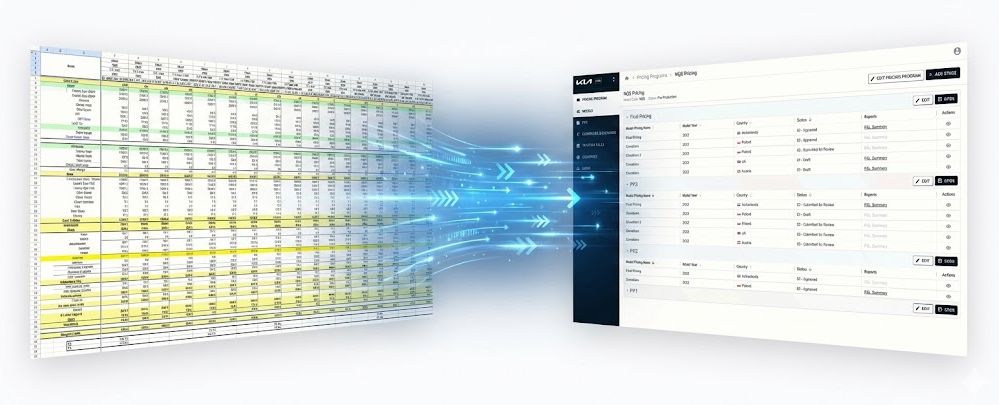
The Setup
Endava was hired by KIA Europe to run a discovery engagement for a new pricing tool. KIA's product pricing teams were managing the entire pricing operation for 13 European markets through a collection of Excel files with heavy VBA automation. The goal was to understand the existing process, define the requirements, and design a modern web application to replace it.
I joined as UX Lead, working alongside a Business Analyst, a UX Designer, and a backend Architect. The engagement was estimated at roughly six weeks.
What we didn't know going in: the contract required delivery of complete Figma designs, not just discovery outputs. What should have realistically been a six-month effort, discovery through full UI design, had to fit inside the original timeline.
The Mess
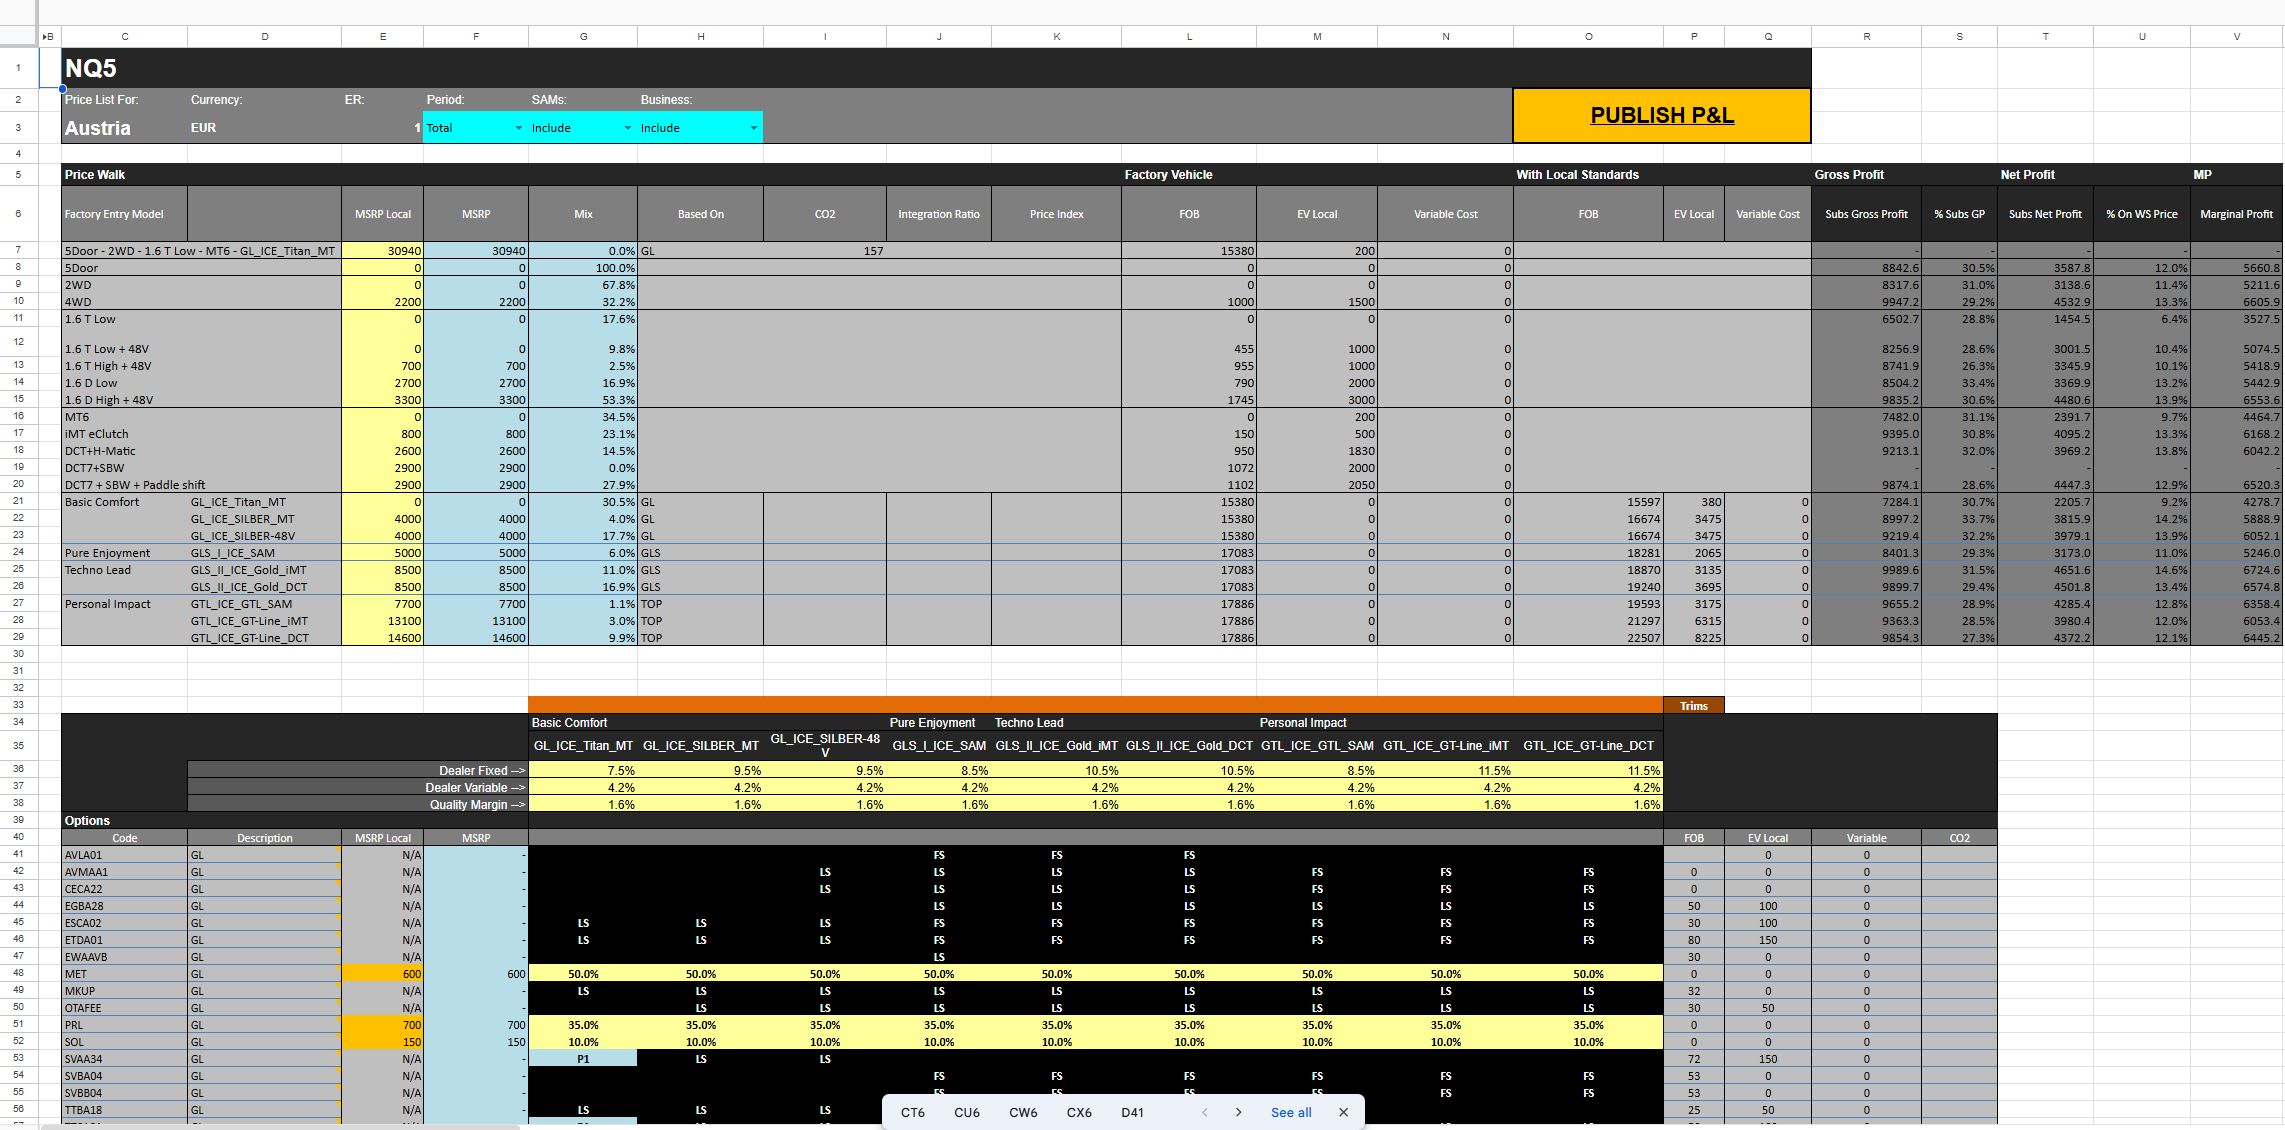
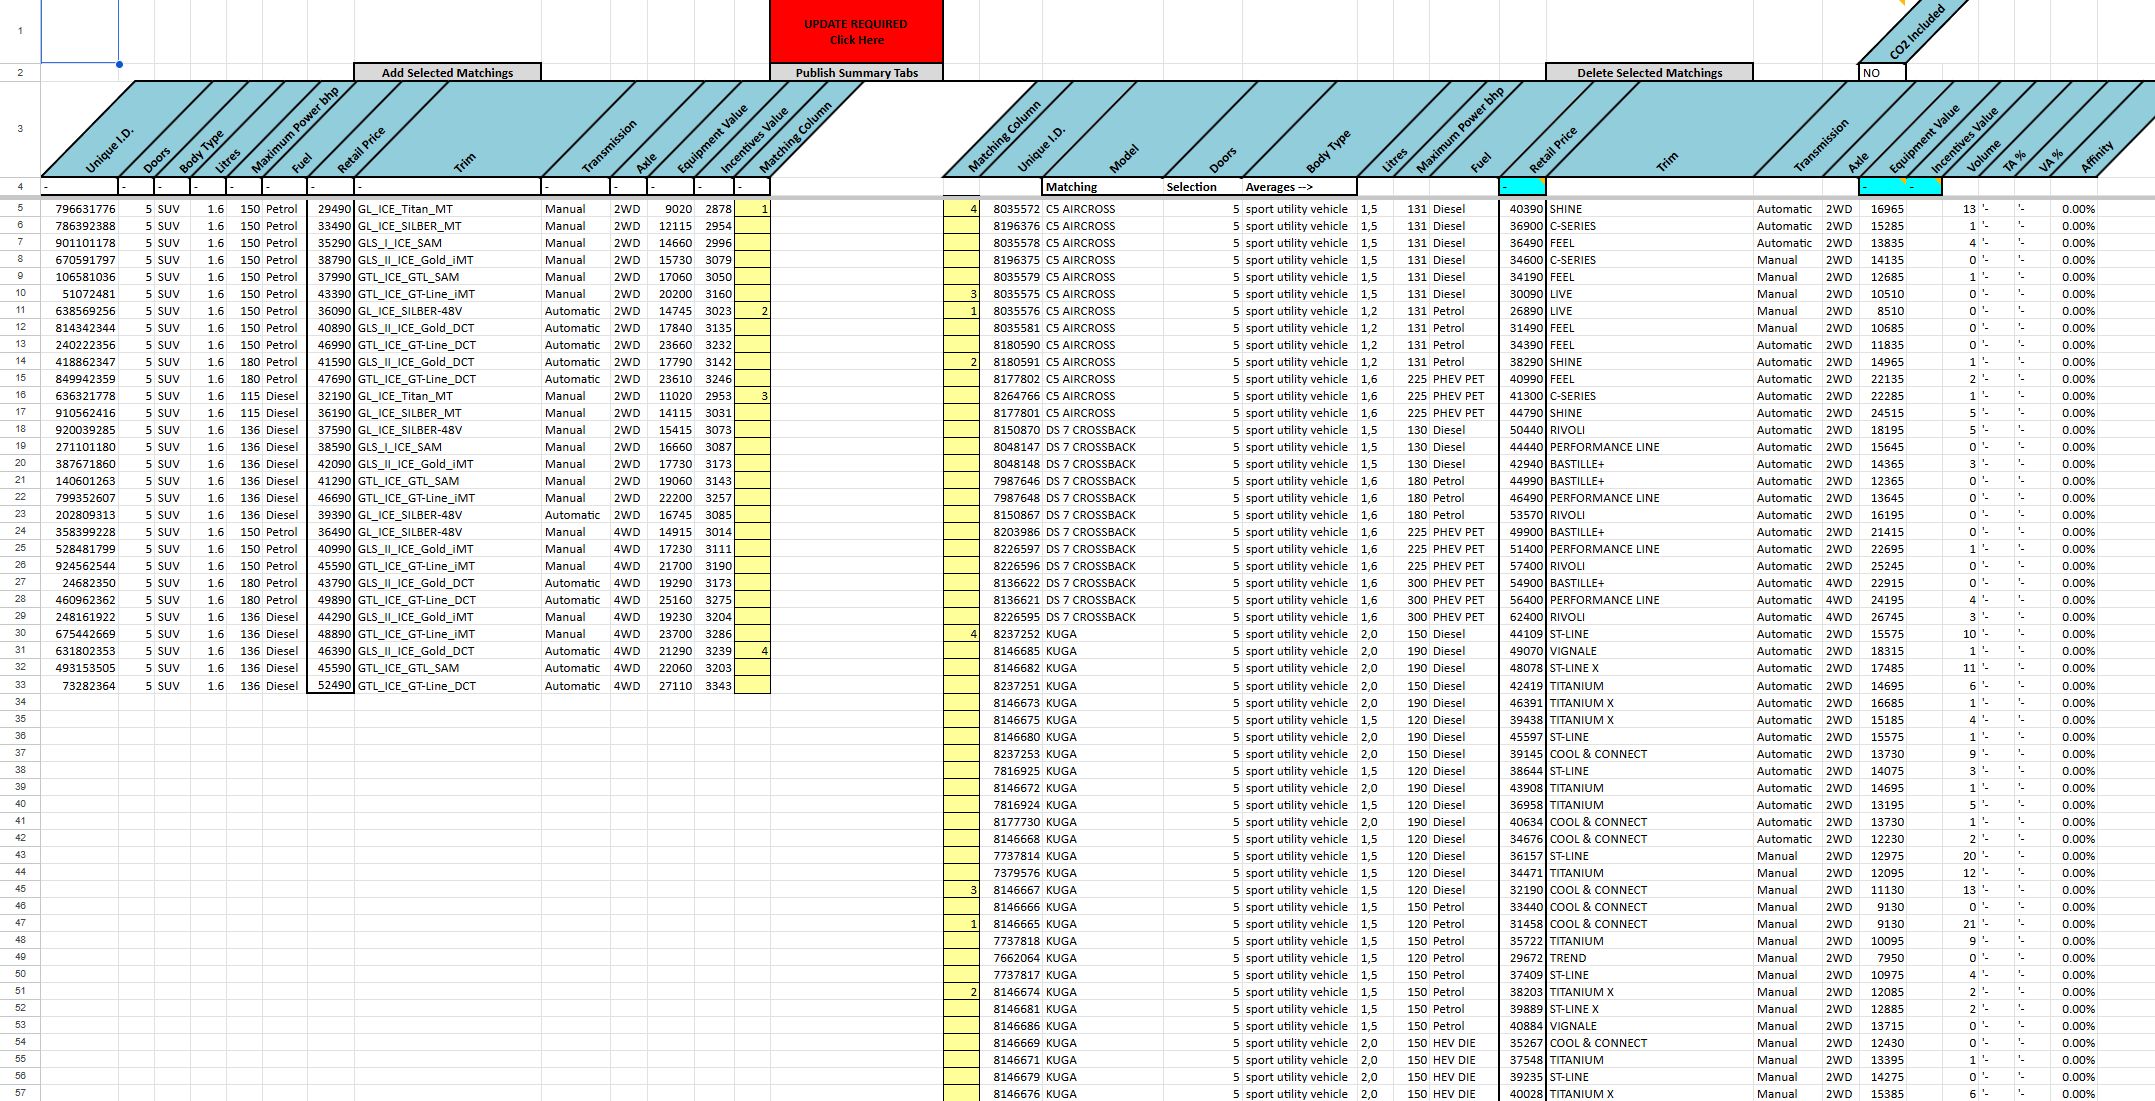
KIA Europe's pricing operation ran entirely through Excel. Not one file. A collection of interconnected spreadsheets with VBA macros, each one covering a different piece of the puzzle: ordering specifications, option codes, pricelists, P&L calculations, competitive analysis, CO2 taxation, FOB harmonisation with currency conversion.
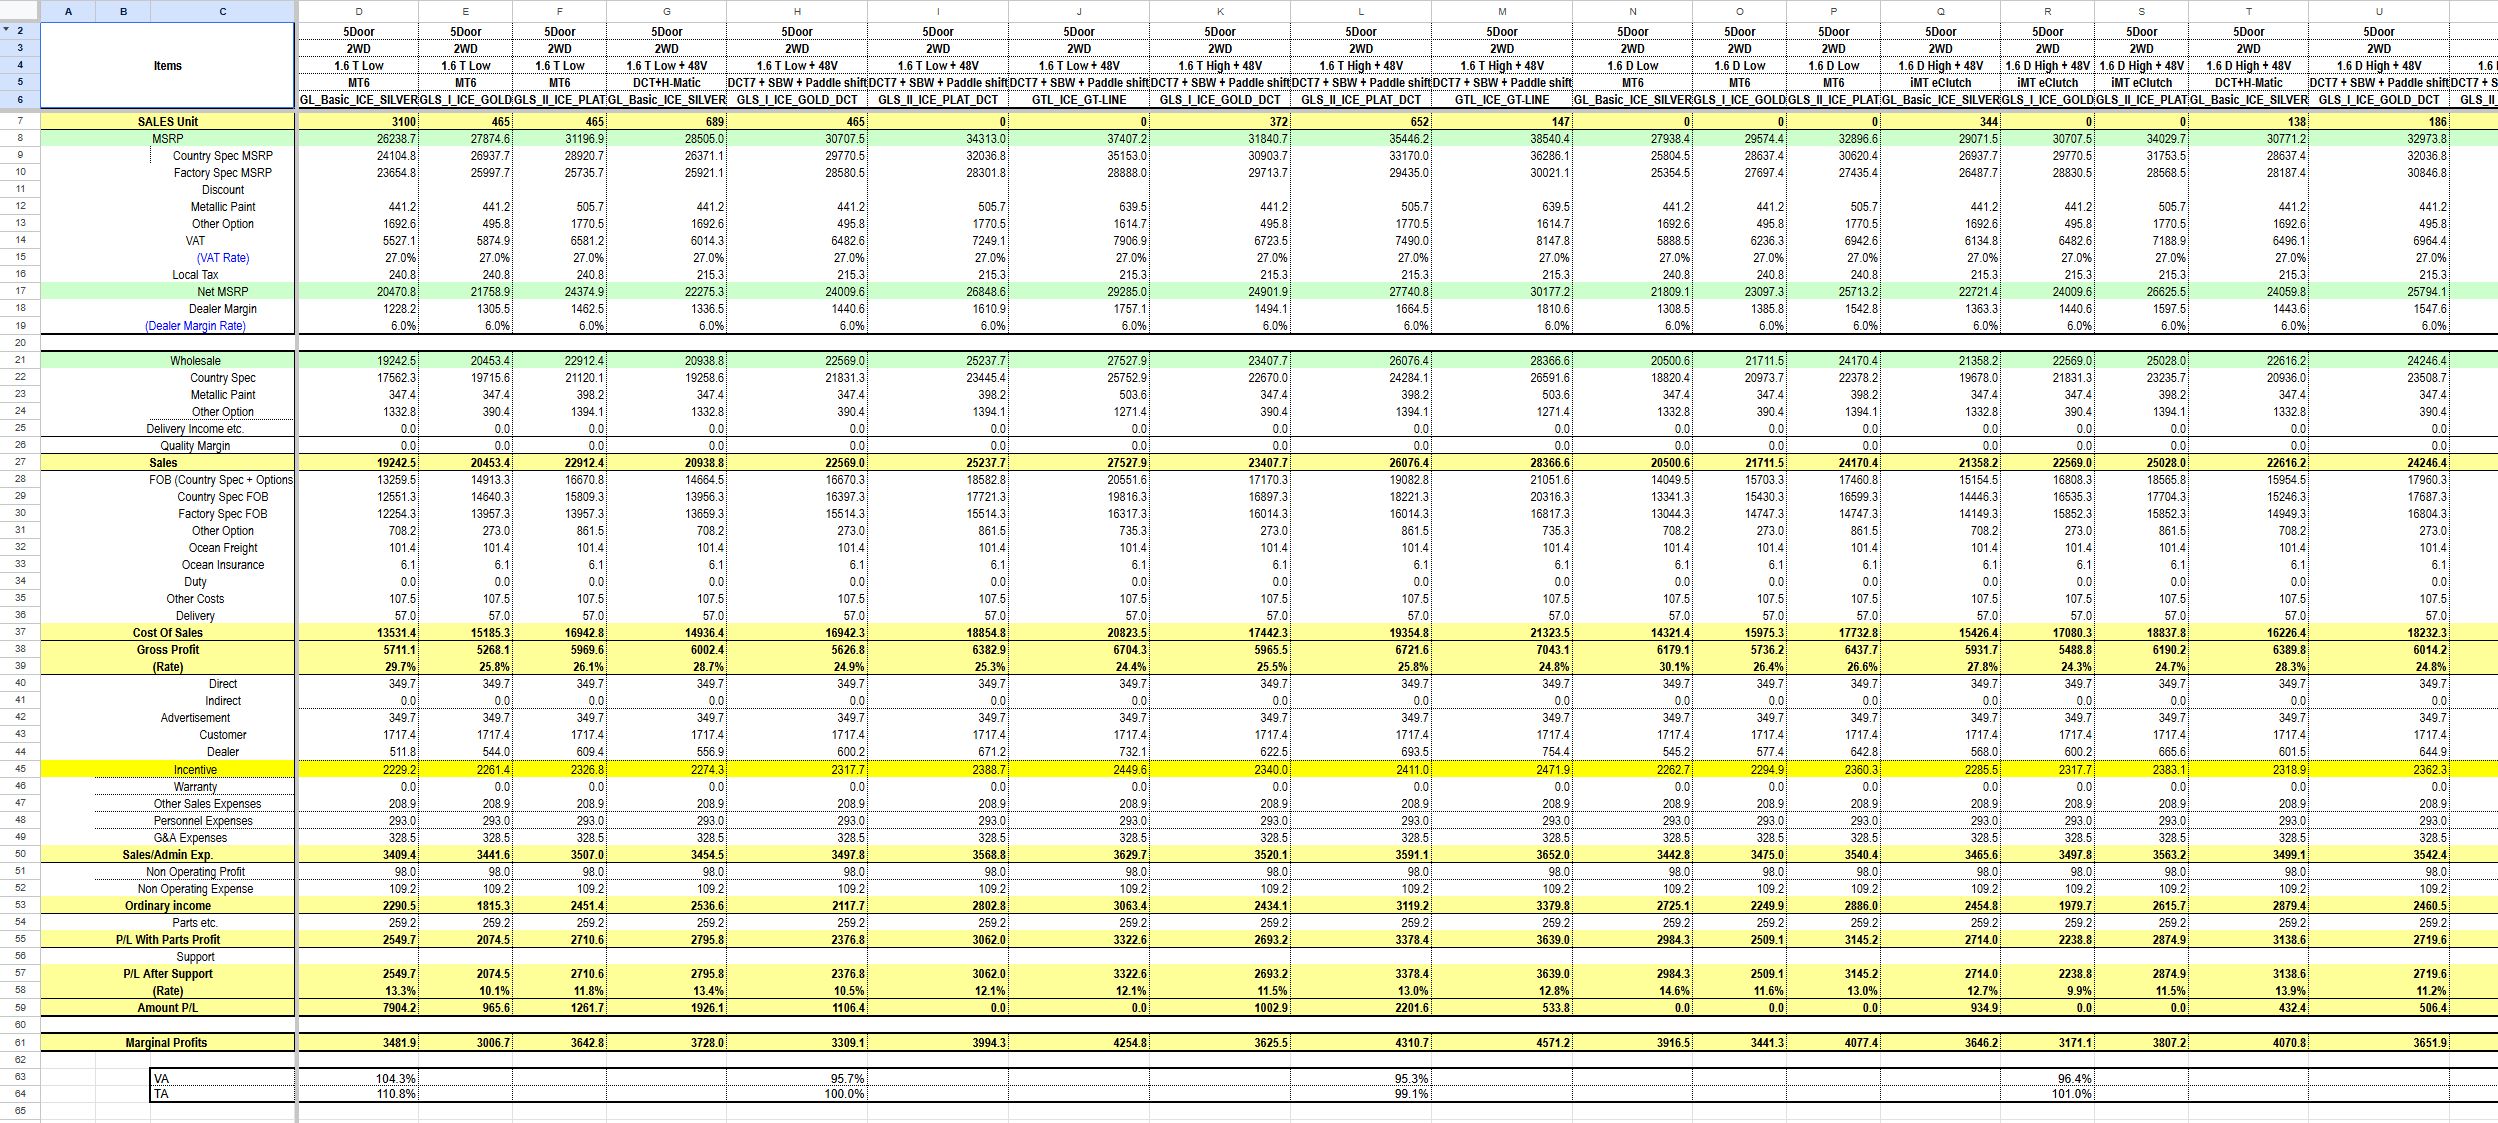
One file alone, the Aggregation Master, had 48 sheets. It contained P&L breakdowns and pricelists for 13 European markets, each with their own option databases. A single option code grid could be over 200 rows by 270 columns. Then there were separate country-specific files, each with 30+ sheets of their own. On top of that, competitive analysis files pulling JATO industry data, CO2 taxation tables that varied by country, and ordering specifications with nearly 900 rows of configuration codes defining what could be combined with what.
Every day during discovery, another file would surface. We'd ask a question about one part of the process and the answer would be "oh, that lives in a different spreadsheet." Each file was another door to open and make sense of.
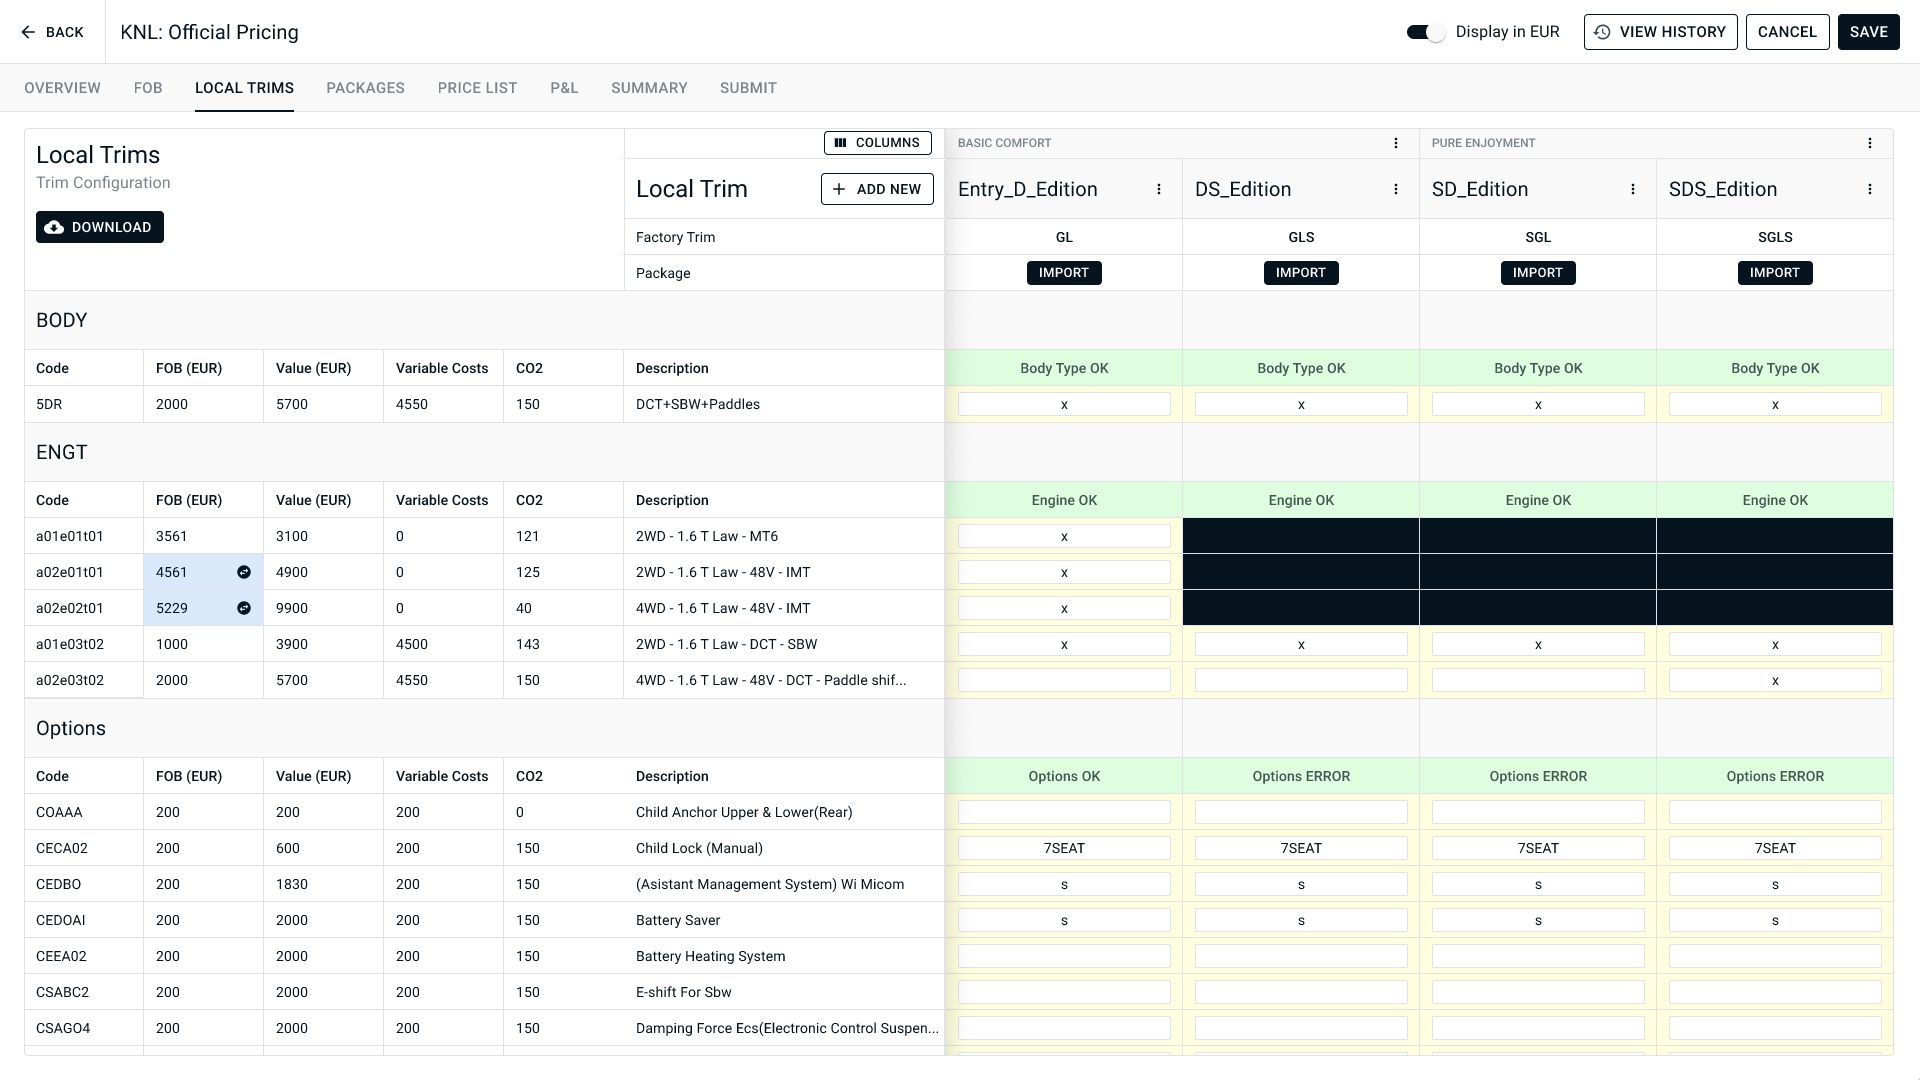
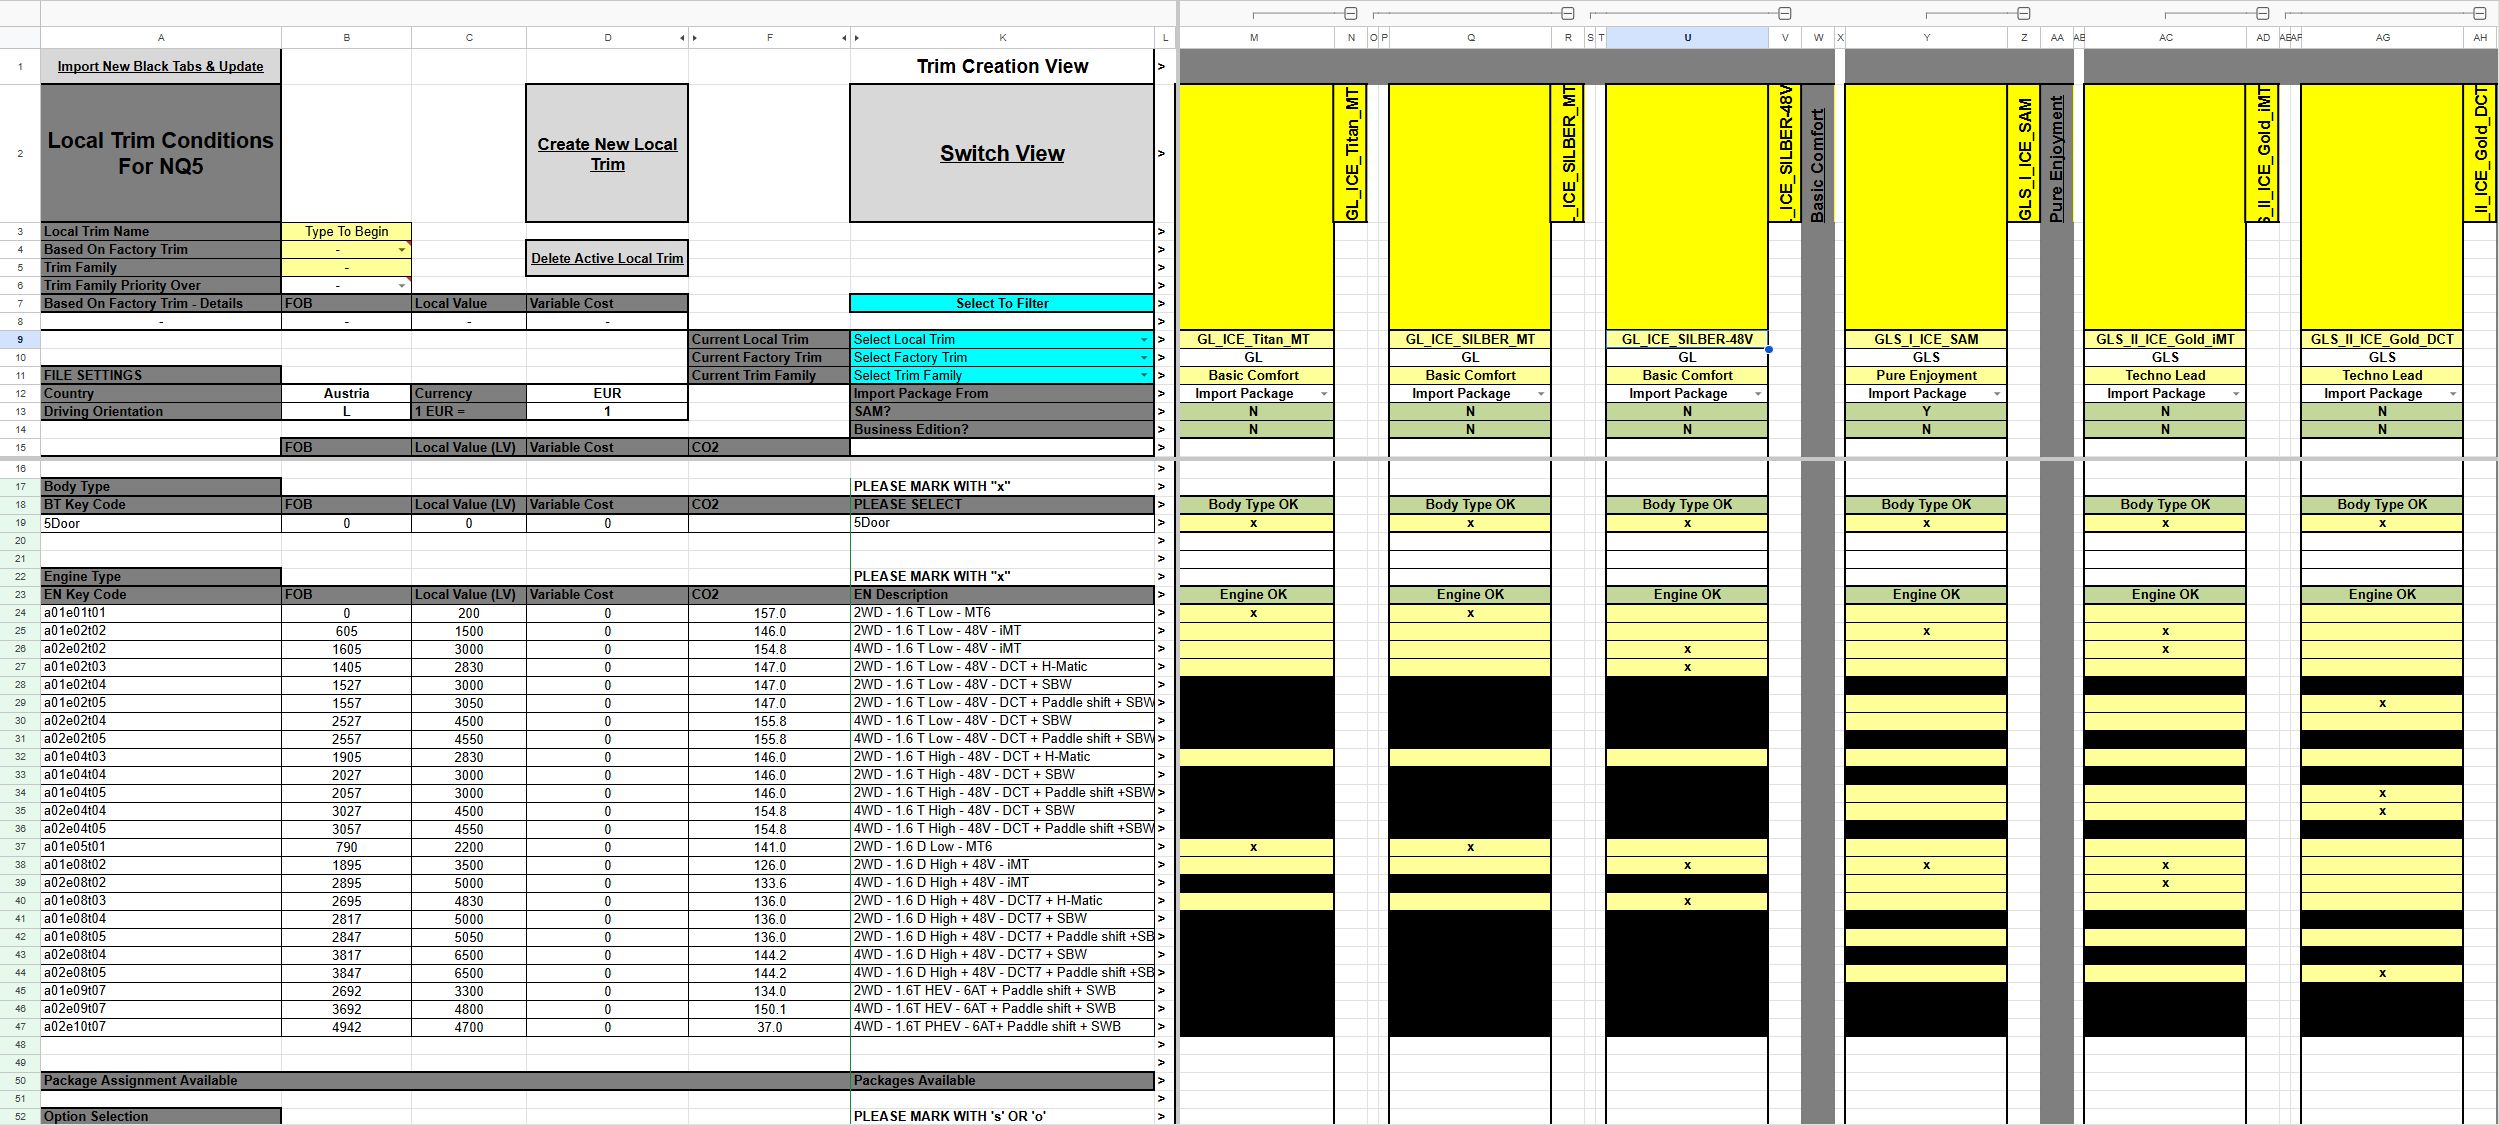
The domain itself was new territory. None of us had worked with an automotive company before. We didn't know what a "Trim" was, what "BlackTabs" meant, or how a car actually gets configured for different markets. It took several sessions before it clicked, and it clicked through a specific example: in Portugal, a base trim comes with standard seats. In Sweden, that same base trim might come with heated seats. Same car, same trim name, different contents depending on the country. That one example unlocked why the system was structured the way it was, and why it was so complex. The pricing wasn't just per car. It was per car, per trim, per market, with each market potentially redefining what a trim actually includes.
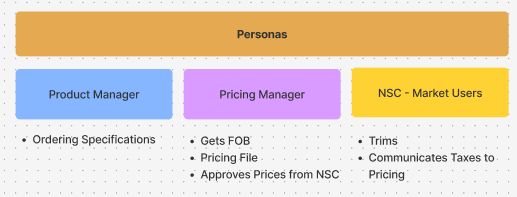
The three user groups reflected that complexity. Product Managers owned the ordering specifications, the master definition of how a car can be built. Pricing Managers worked across markets doing the actual pricing, P&L, and competitive analysis. NSC Market Users handled the country-specific side: local trims and taxation.
The process these teams followed had been shaped by the Excel files themselves, not by what they actually needed. The tool had started dictating the workflow. Our questions during discovery weren't just helping us understand their process. They were forcing the client to re-examine it too.
Making Sense of It
We ran daily workshops with the Pricing Team, one to two hours each, where I led the discussions. The format was simple: ask questions about their process, look at the files together, map what we learned. Every session would surface another Excel file, another piece of the puzzle we hadn't seen yet.
The first challenge was the domain itself. Nobody on our team had worked with an automotive company before. We didn't know what a Trim was, what BlackTabs meant, or how a car gets configured for different European markets. We had to learn the industry before we could redesign anything.
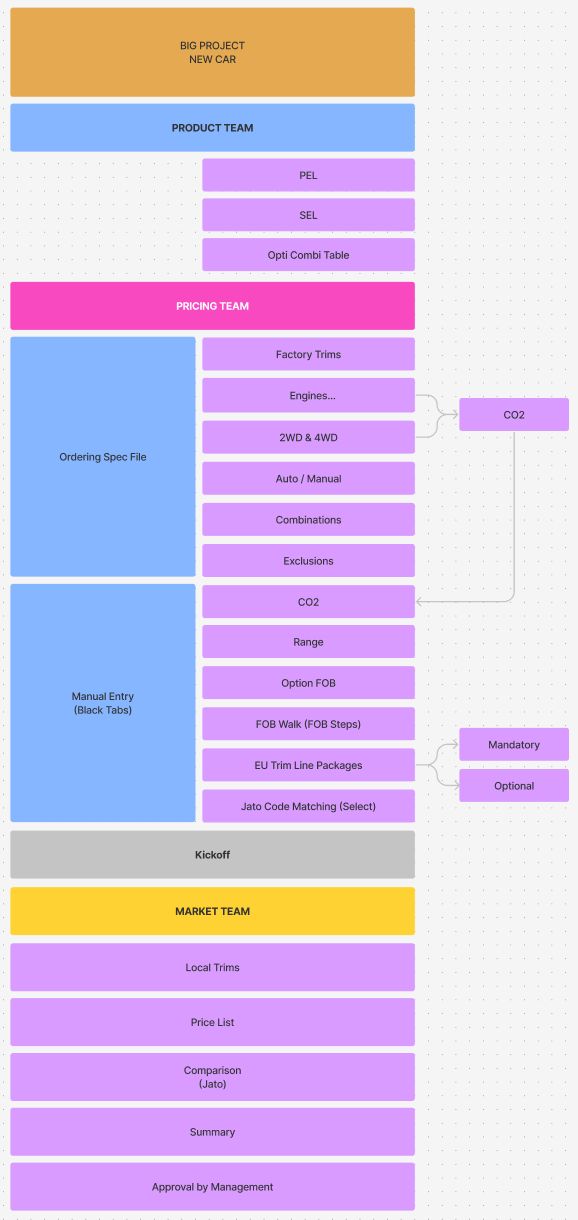
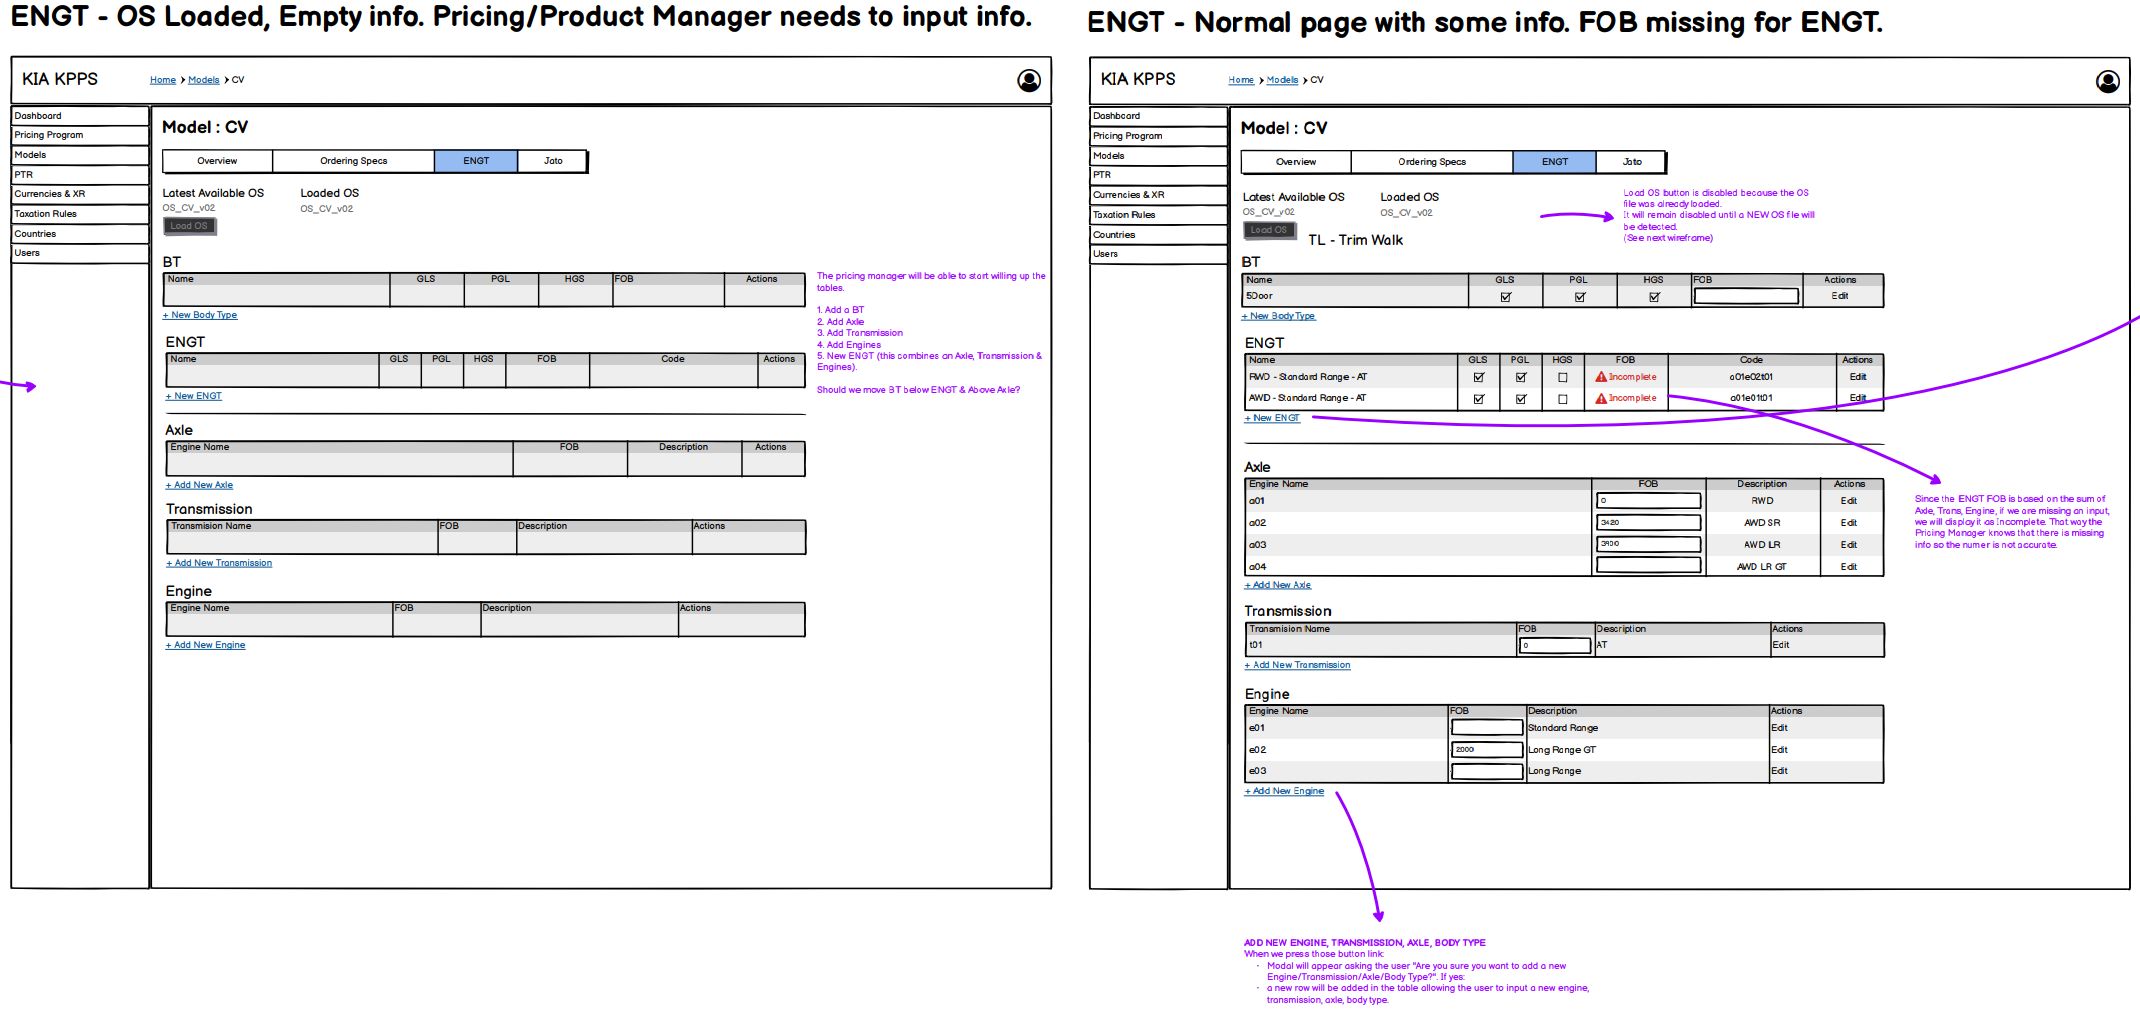
It started making sense once I mapped the full process flow across the three teams. The Product Team owned the ordering specifications and the master configuration of each vehicle. The Pricing Team took that input and worked through Factory Trims, engine types, drivetrains, option combinations and exclusions, then the manual data entry phase covering CO2 values, FOB pricing, EU trim packages, and competitive JATO code matching. After a Kickoff, the Market Team for each country would create their local trims, build pricelists, run competitive comparisons, and submit for management approval.
Mapping this flow did two things. It gave us a clear picture of how pricing actually worked end to end. But it also made the client re-examine their own process. A lot of what they were doing wasn't driven by what they needed. It was driven by what Excel allowed or forced them to do. The tool had shaped the workflow instead of the other way around.
Creating Structure
The first thing I did was separate configuration from workflow. In the Excel system, everything lived together. Currency exchange rates, taxation rules, country settings, model databases, JATO codes. All of it was embedded inside the same spreadsheets where people were doing their daily pricing work. If something changed at the configuration level, it rippled unpredictably through the files.
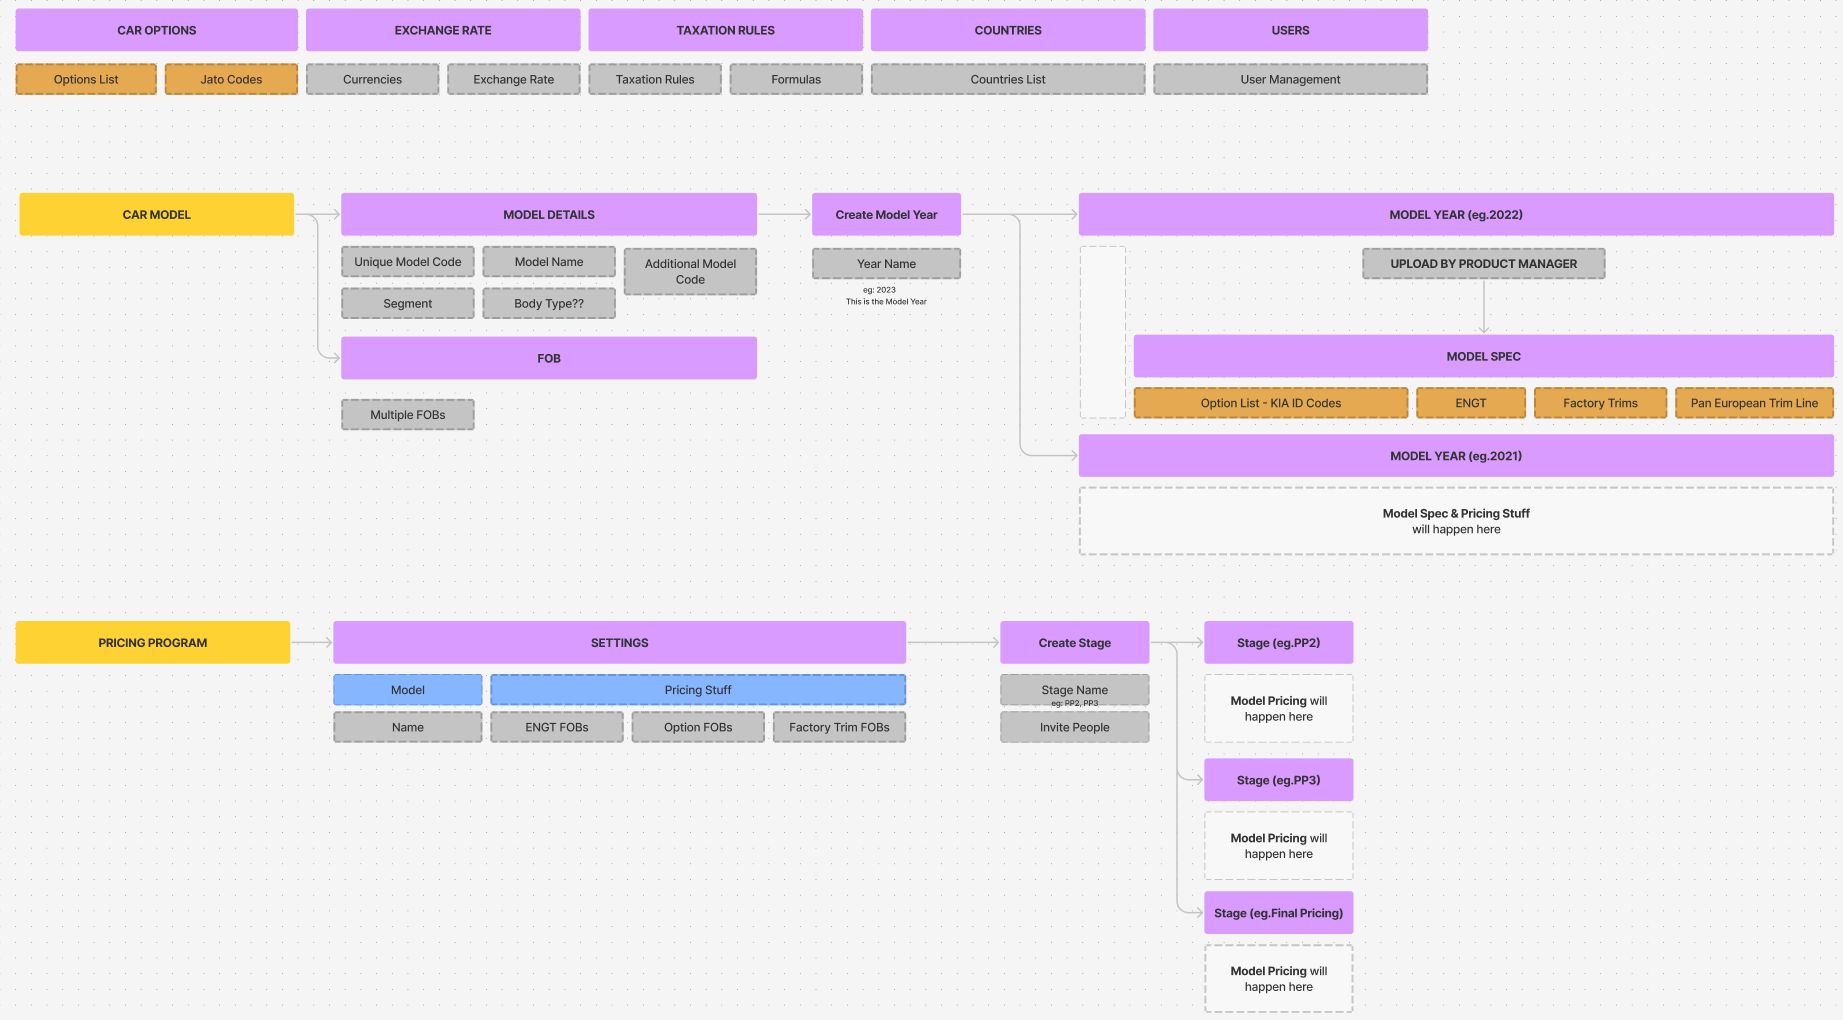
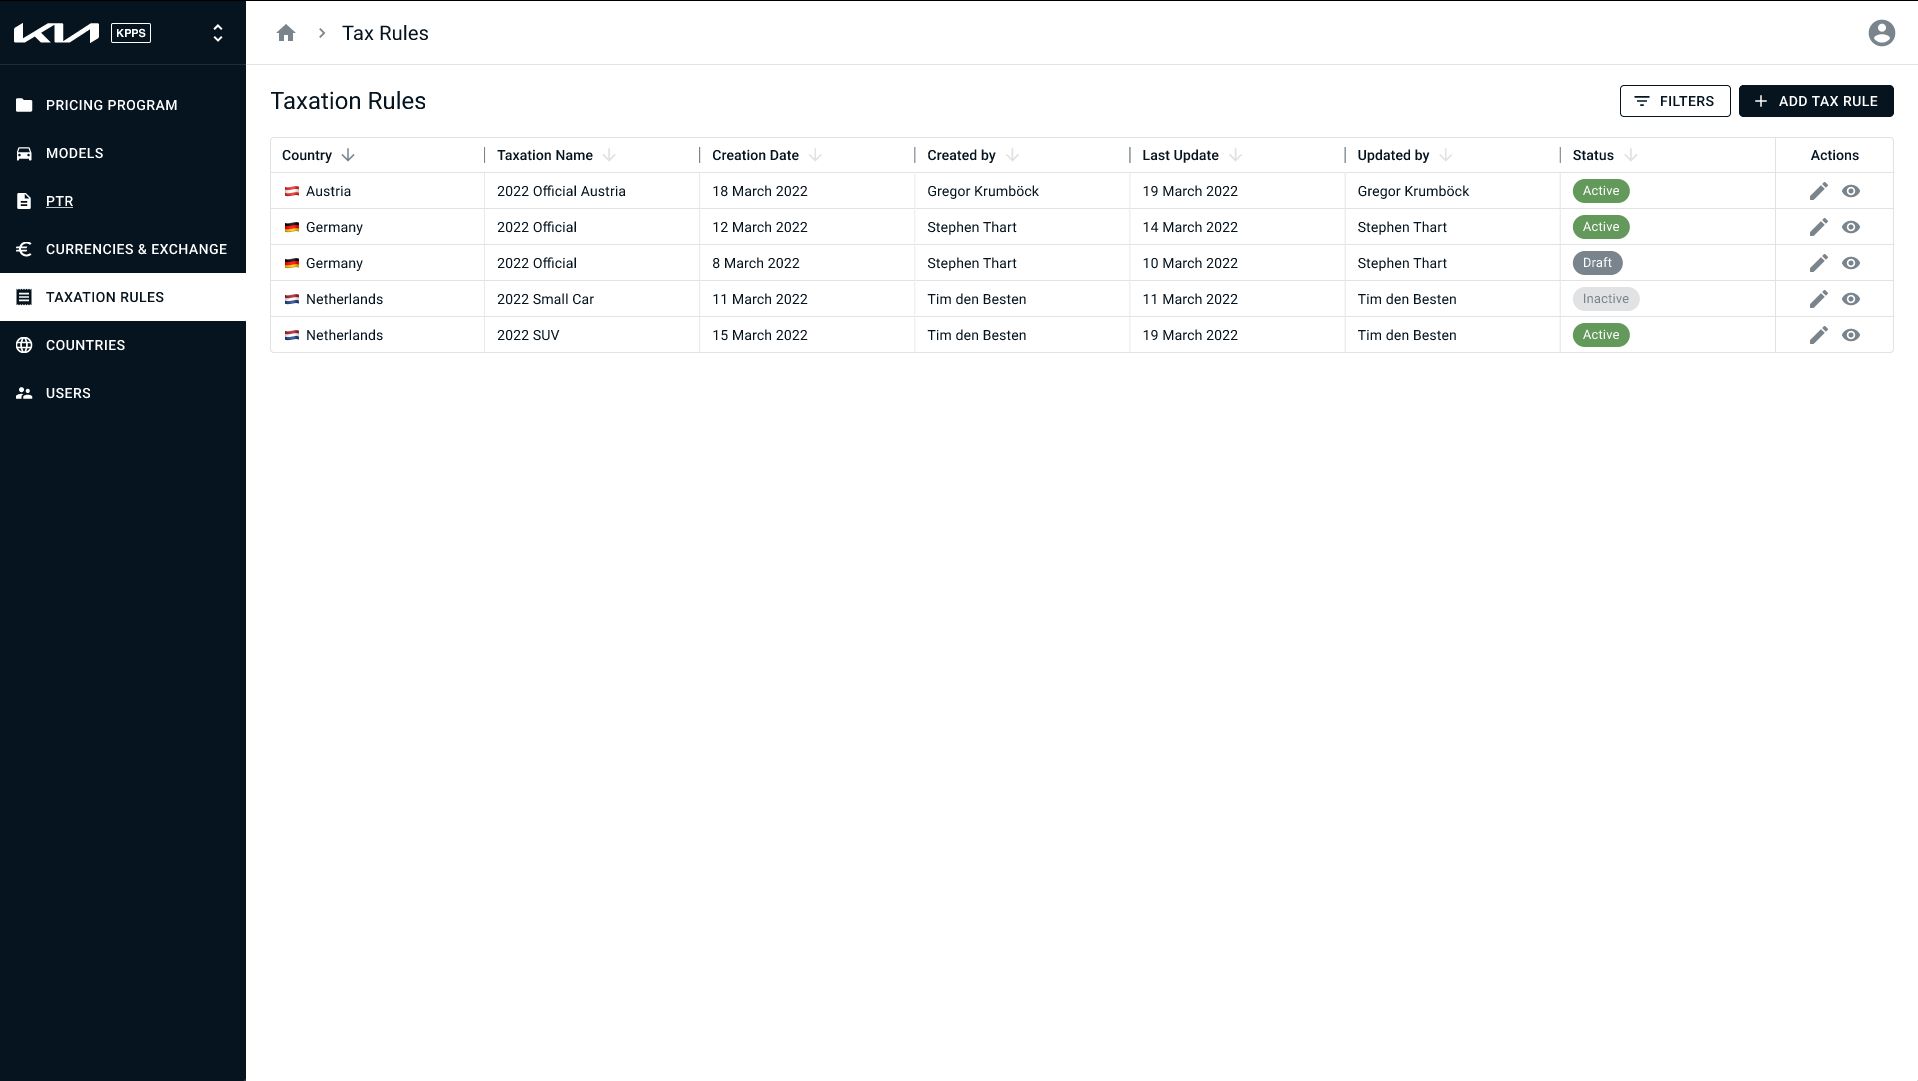
I pulled out six areas that should be managed independently: Currency, Countries and Markets, Taxation Rules, User Management, Model Management, and JATO Code Matching. These became the foundation layer of the new application. Set once, managed centrally, referenced everywhere.
Taxation rules alone showed why this mattered. Every country had a completely different set of rules. Austria had one. Belgium had four. Czech Republic needed separate rules for CO2-included and CO2-excluded calculations. France had a simulation rule alongside the current one. In Excel, these were scattered across files. In the new structure, they lived in one place with proper versioning, formula management, and clear ownership of who created or last modified each rule.
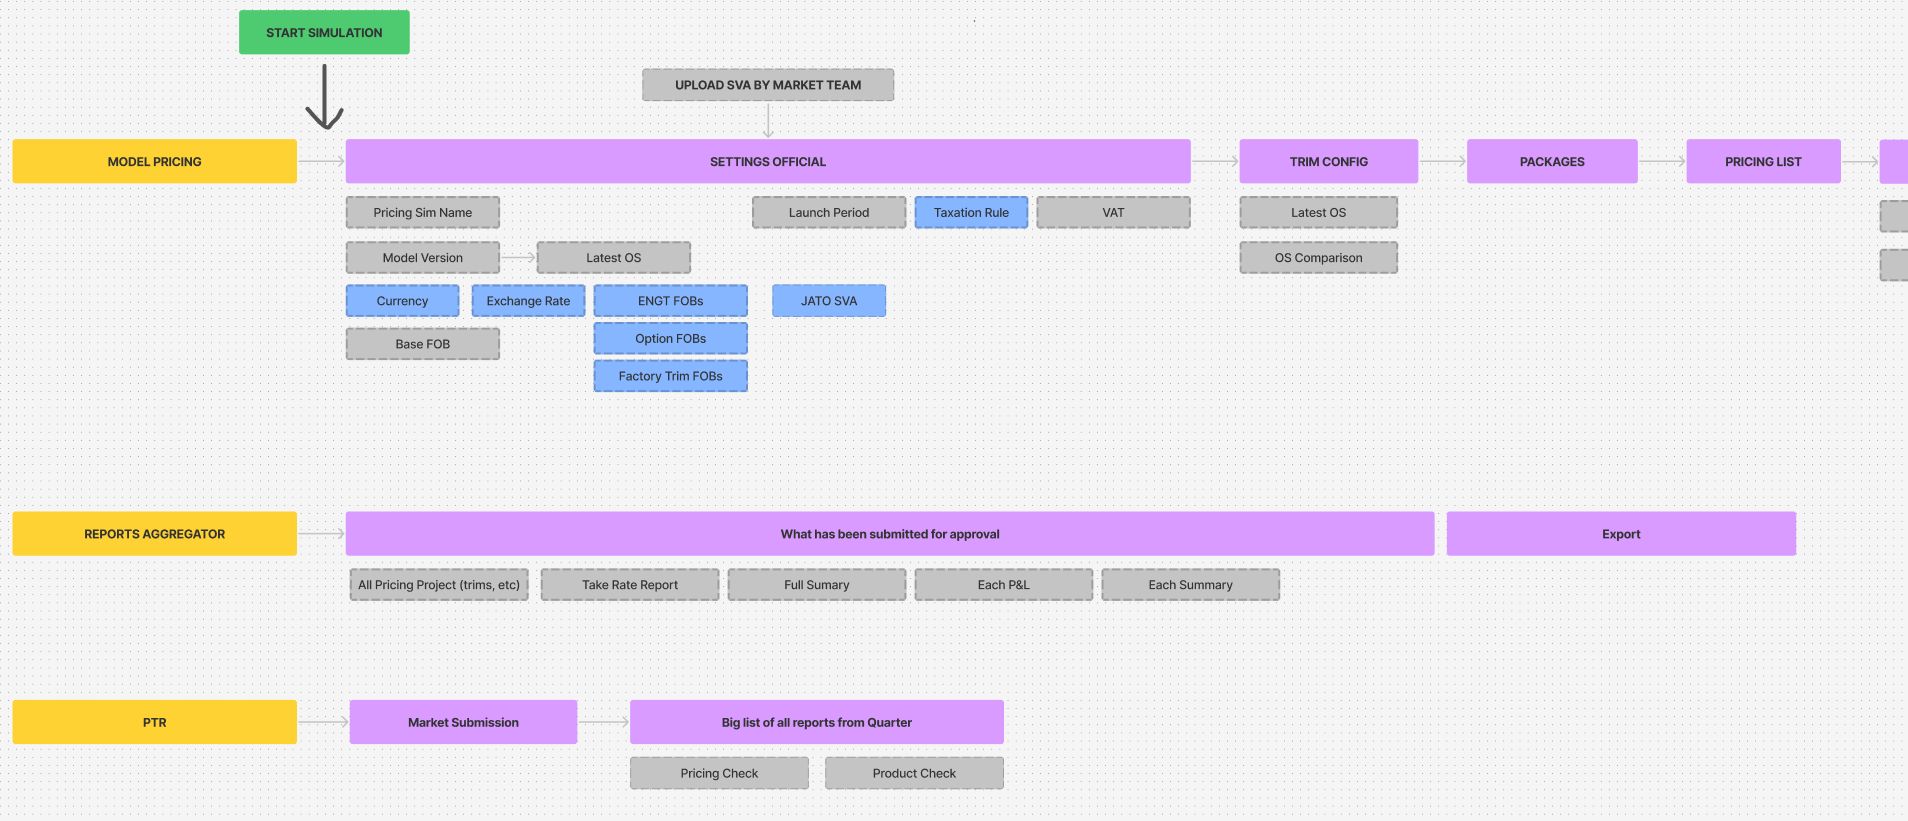
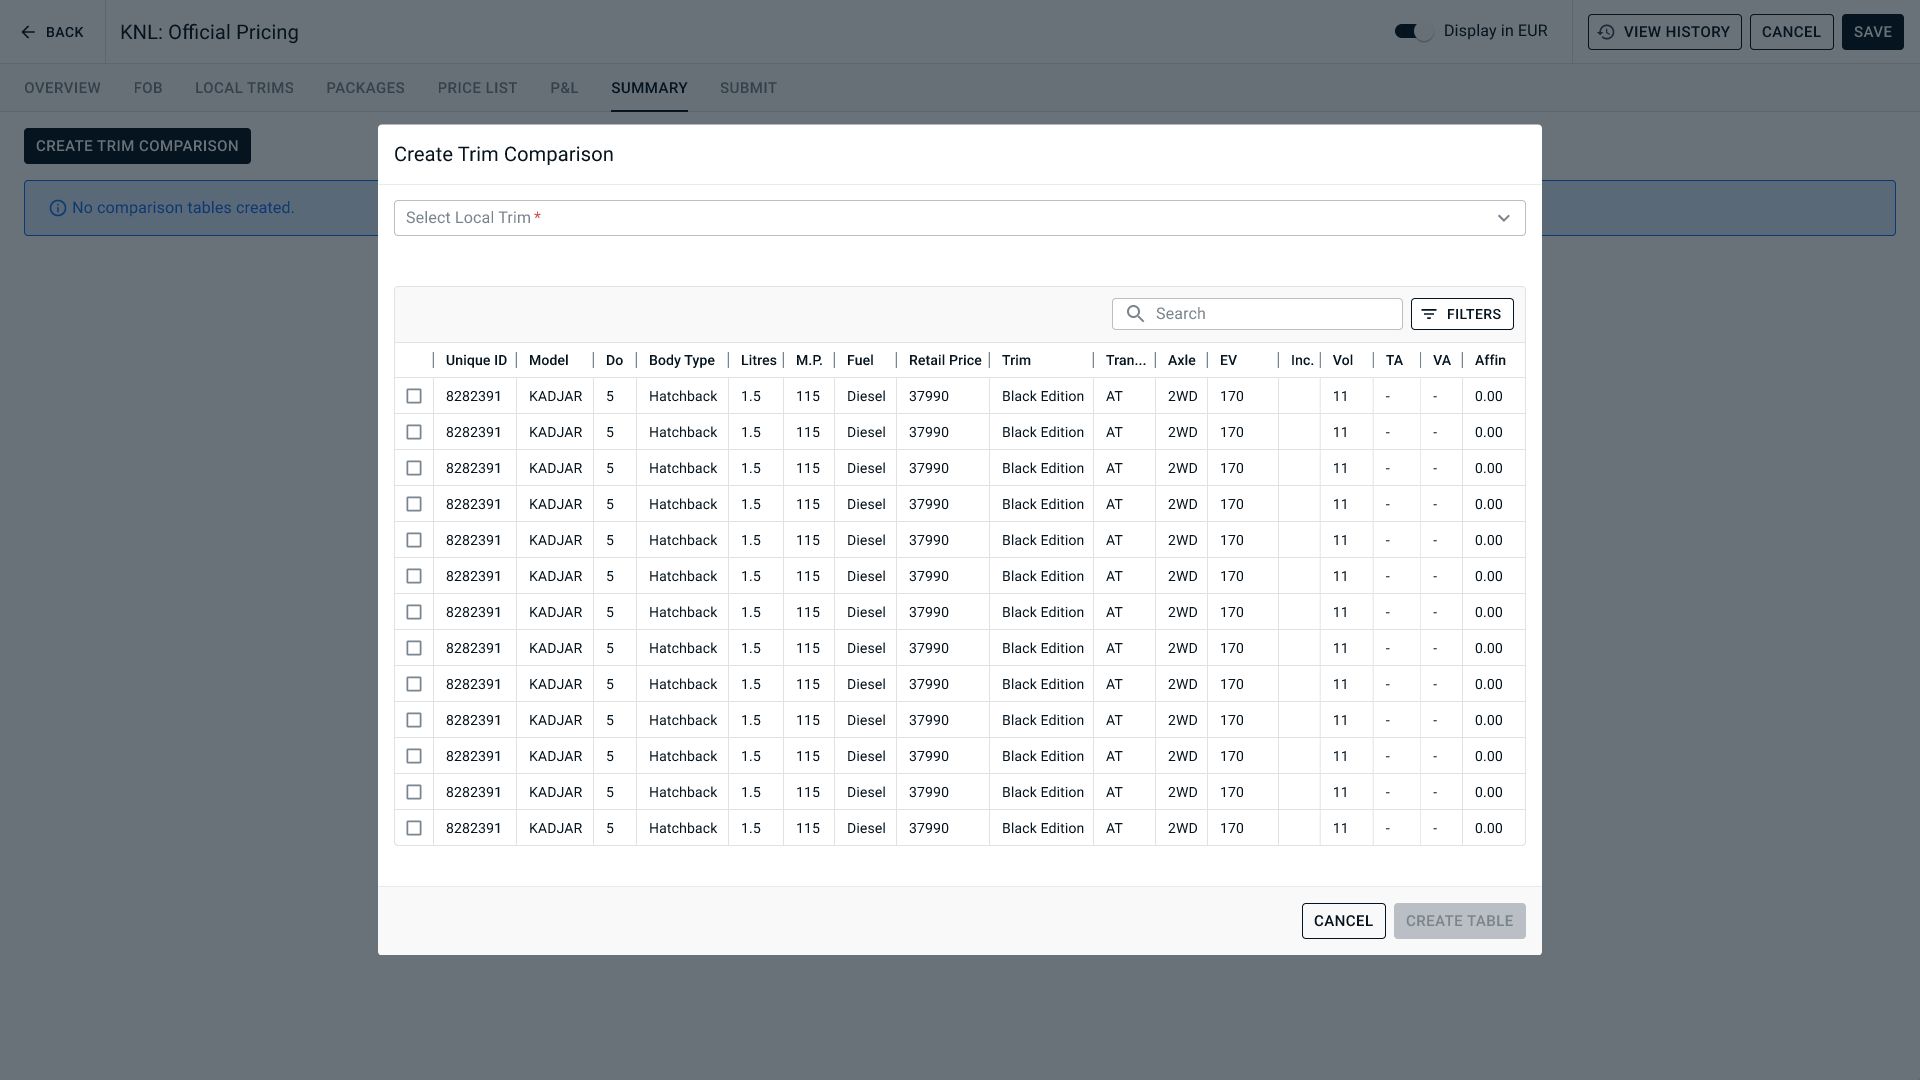
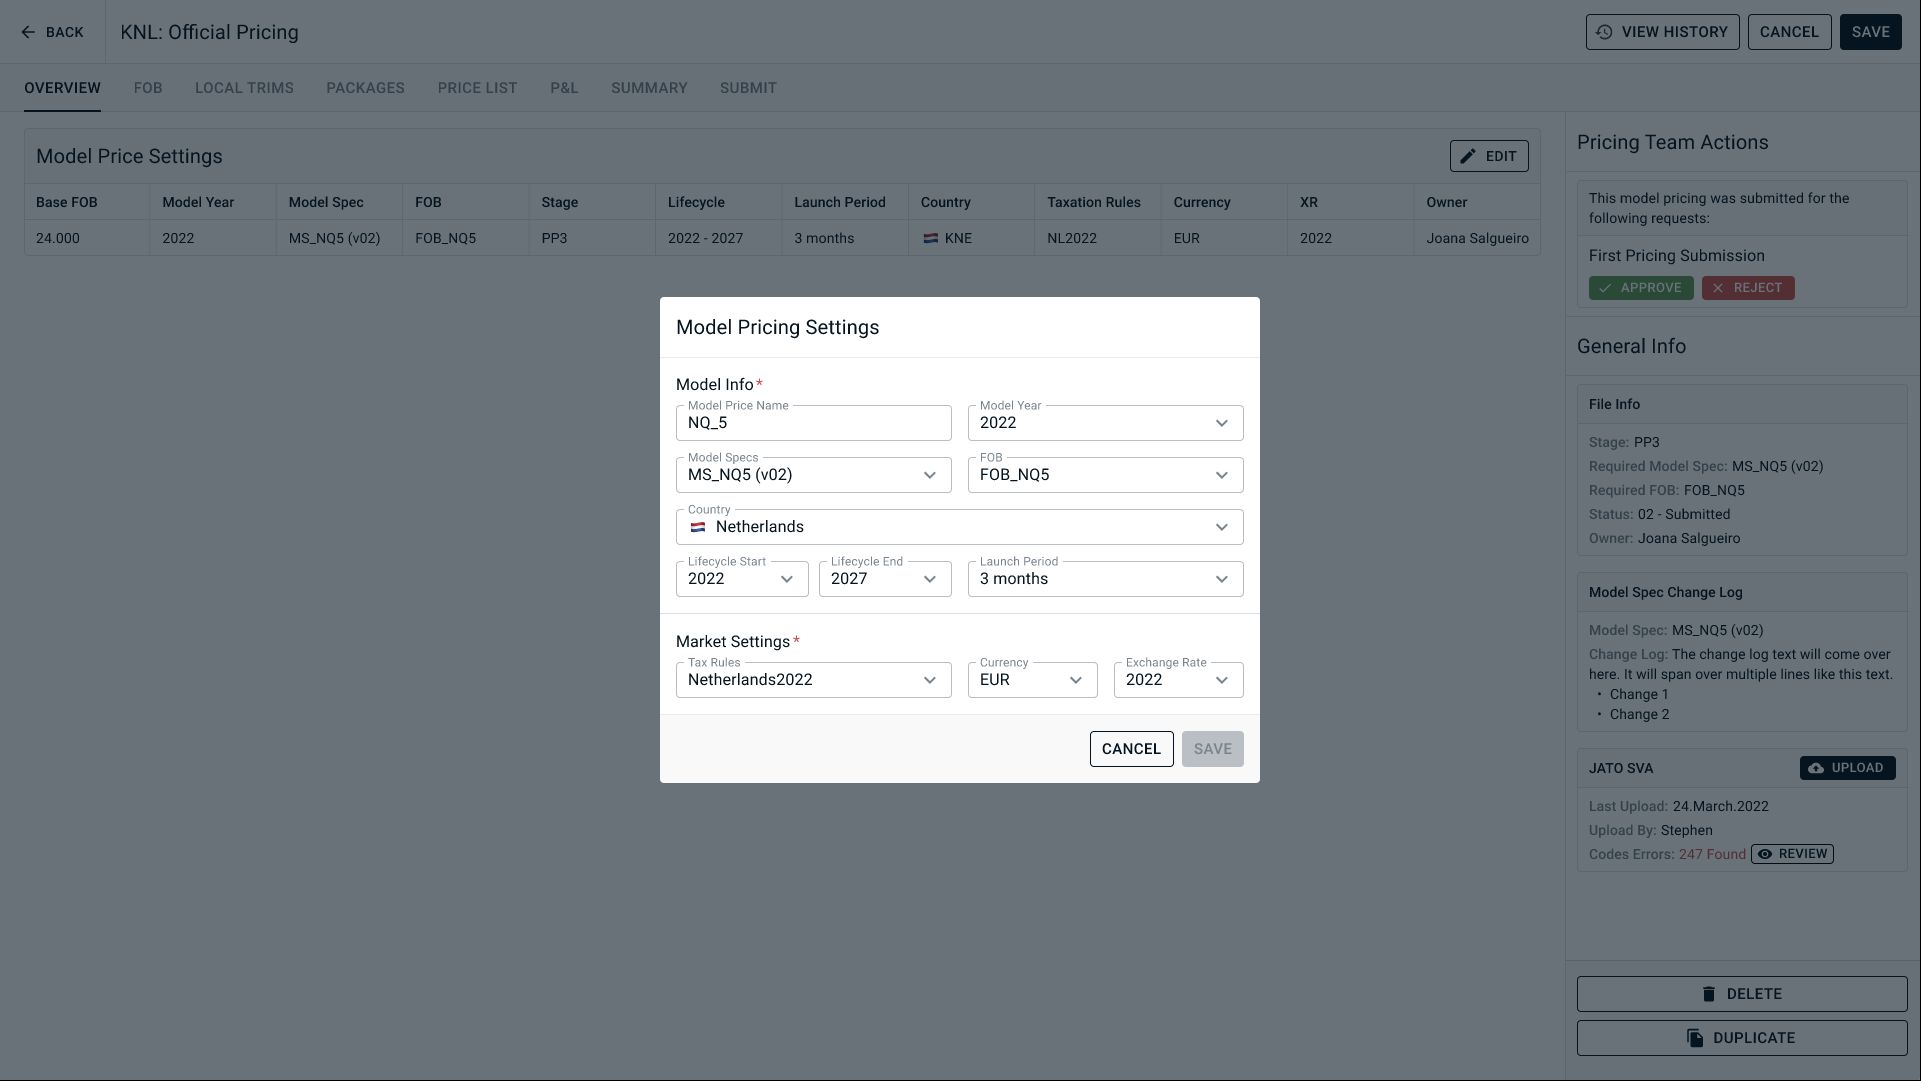
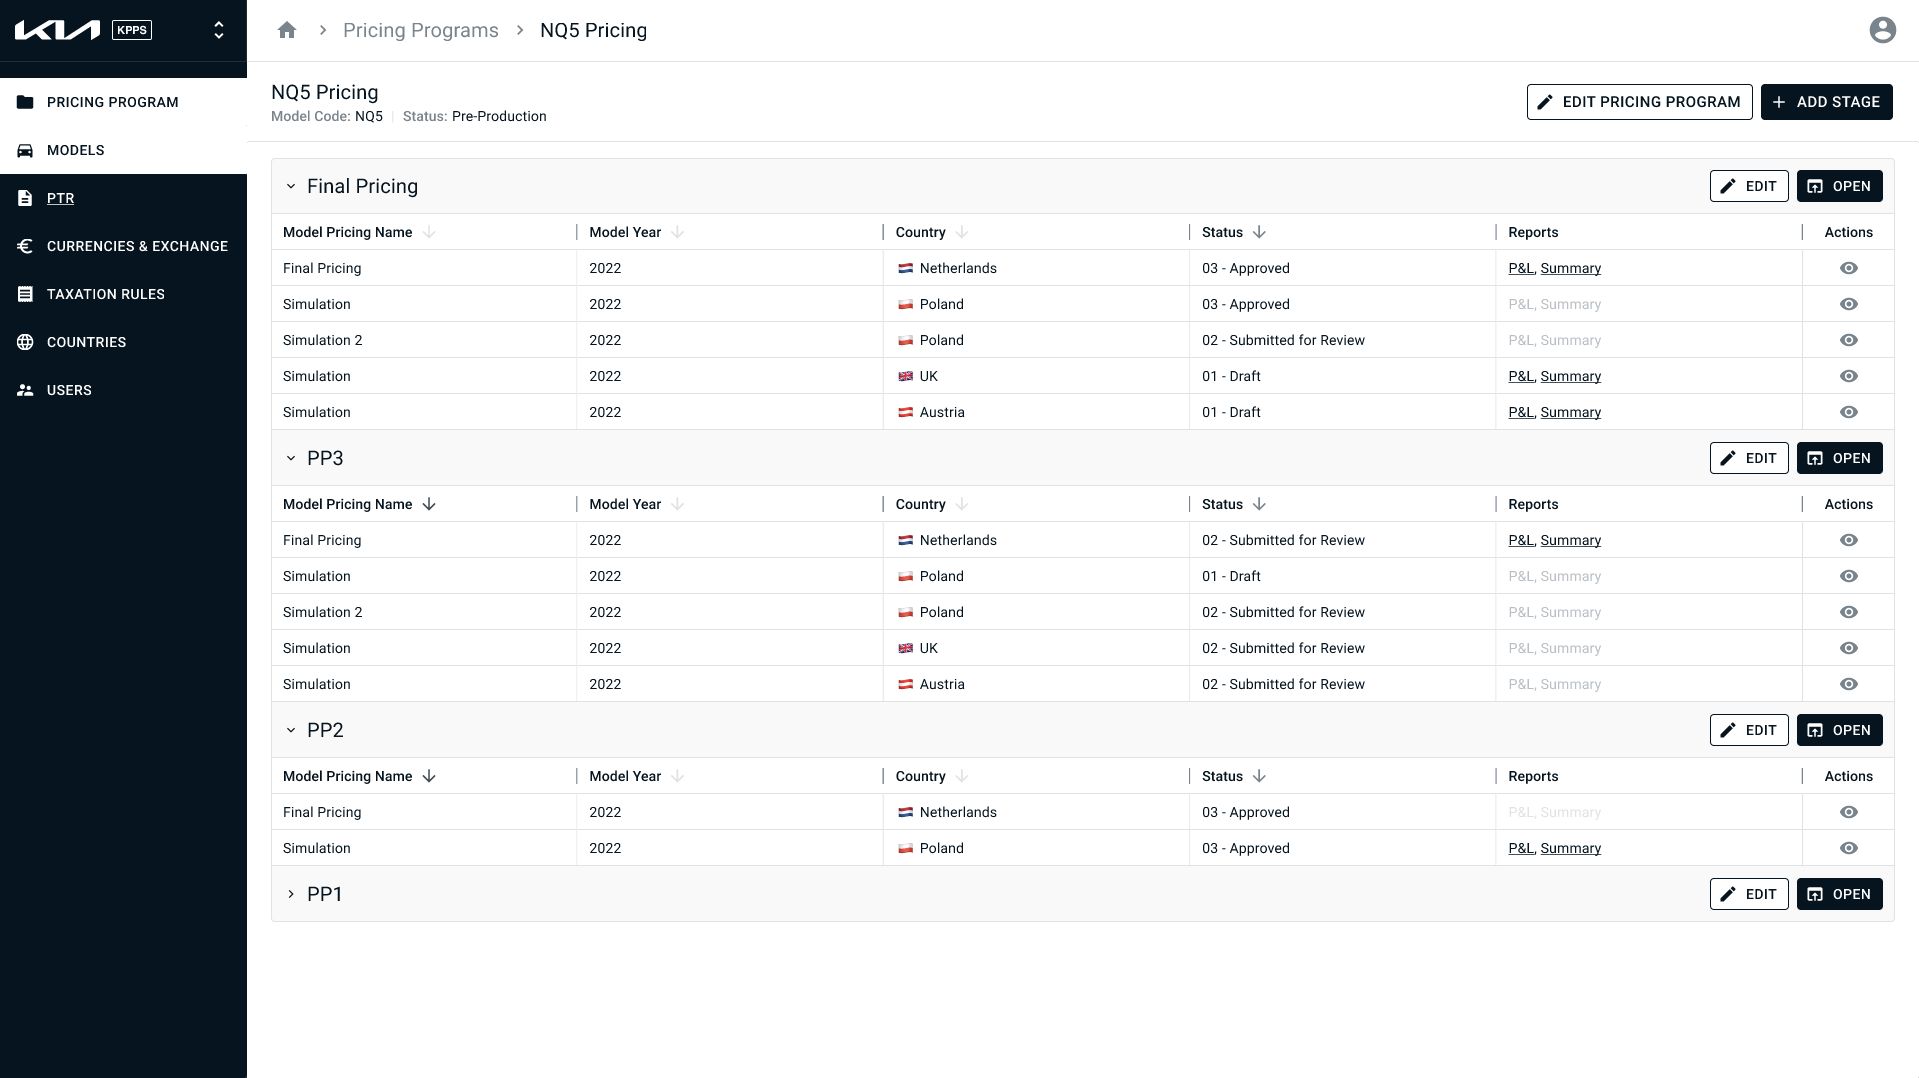
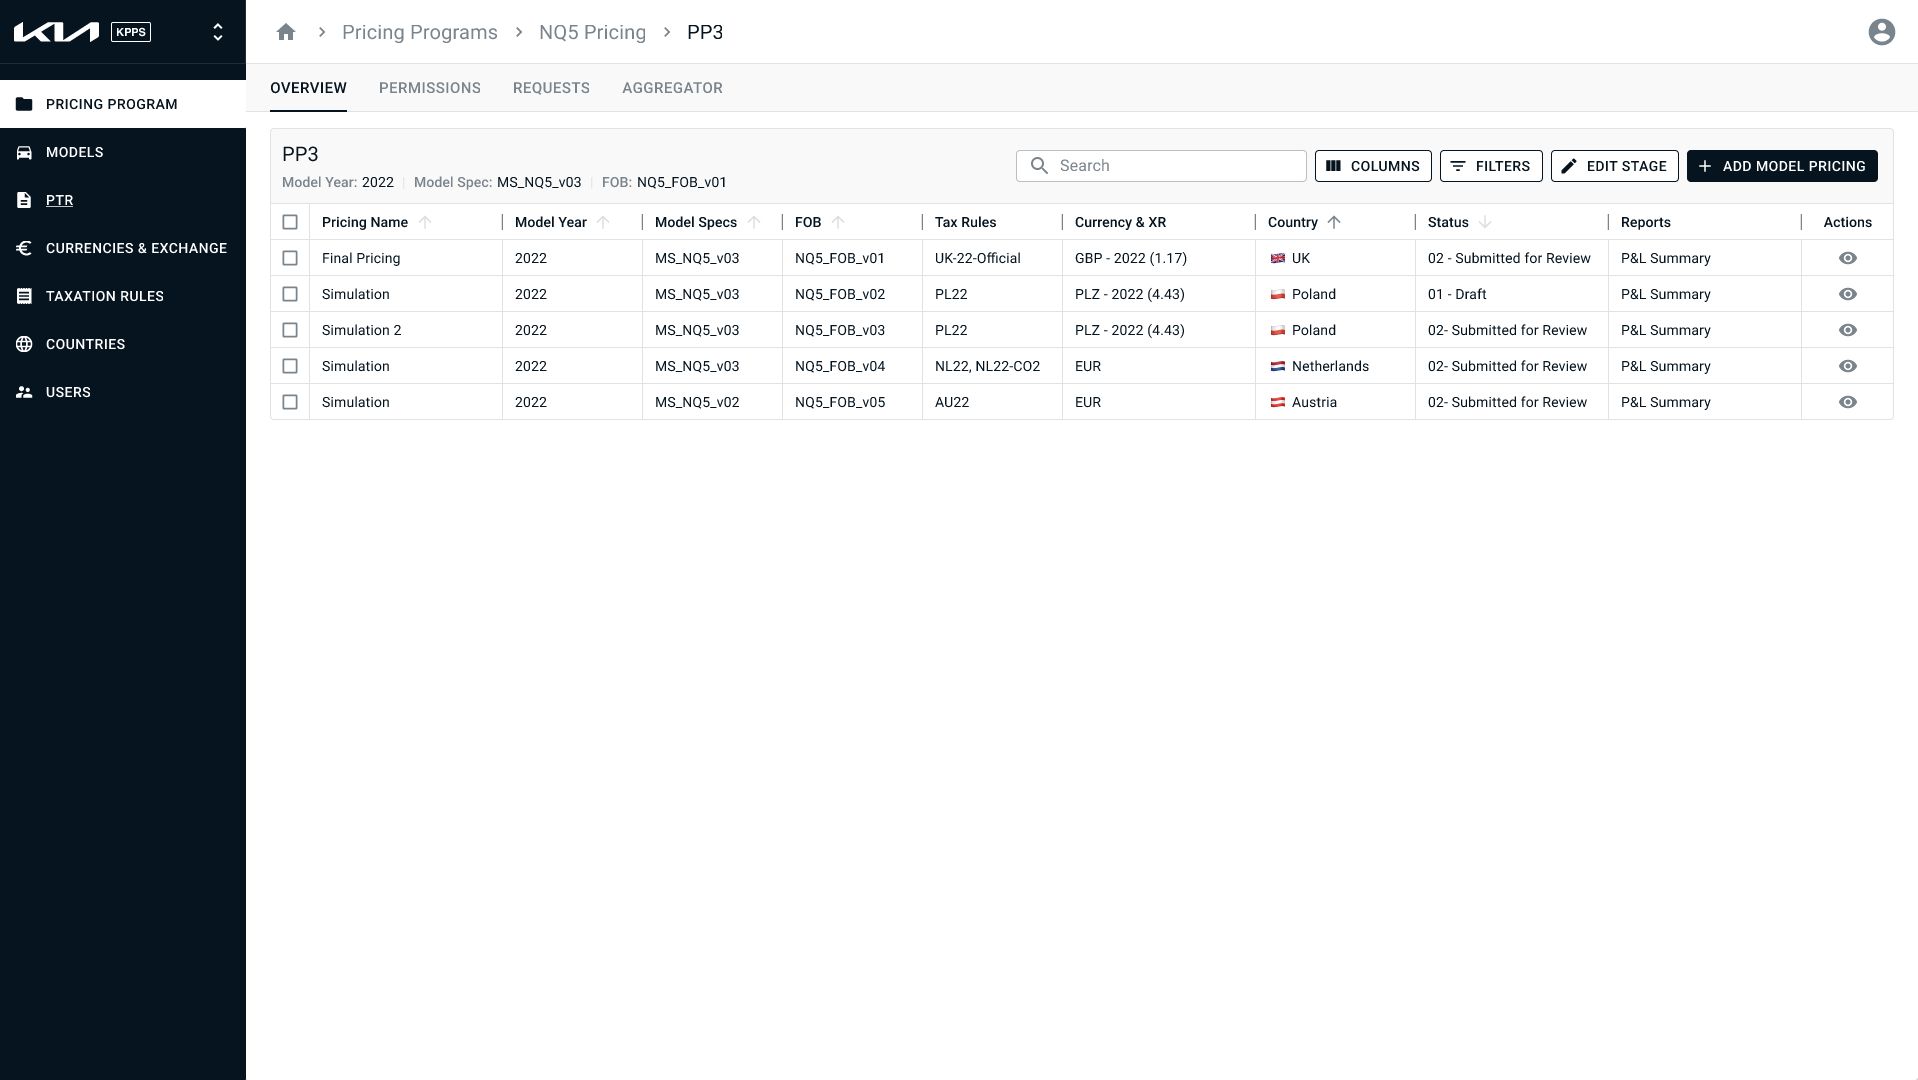
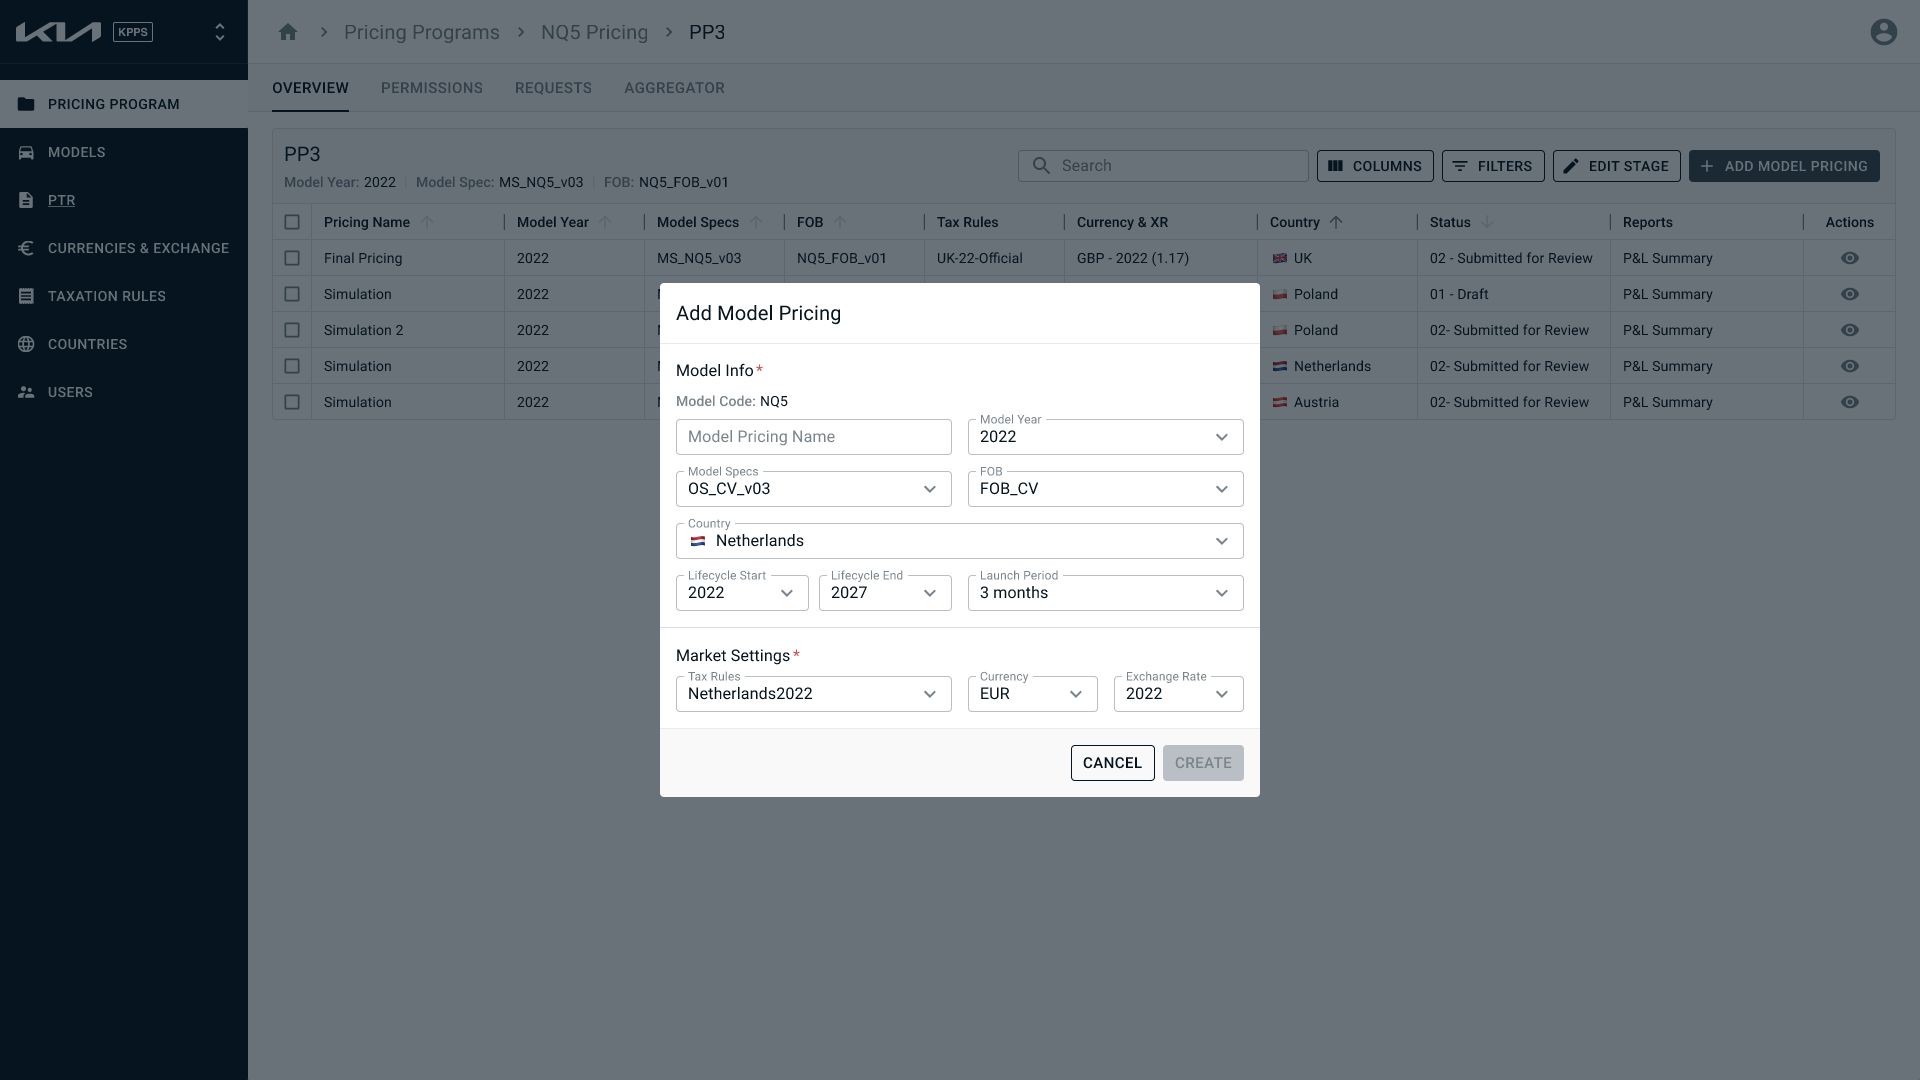
On top of the configuration layer, I designed the core pricing workflow as a stepped process. Create a Pricing Project, select the car model and model year, upload the Ordering Specification, define packages. Then the flow split into two paths: Official pricing and Simulation. Both followed the same steps through Settings, Trim Configuration, Packages, Pricelist, P&L generation, and Summary, but they served different purposes.
This split solved one of the biggest pain points. In Excel, Market Users valued the flexibility to detach from the central files and run their own pricing experiments. But that same freedom created problems for the Pricing Team because they could never be sure if the numbers the markets were using were accurate or current. My solution was to let Market Users create as many pricing projects as they wanted. Each project inherited the Pricing Team's official numbers as a starting point, but markets could override them for their local simulations. When the Pricing Team updated official numbers, those changes surfaced in the market projects so users could decide whether to update.
When a Market User was ready, they could submit their pricing simulation to the Pricing Team. At that point, the simulation locked so markets couldn't make further changes while the Pricing Team reviewed. The Pricing Team could run their own numbers alongside the market's submission without overwriting anything. Then they'd approve or reject. Approved simulations became official and fed into the Aggregator. Rejected ones unlocked so the Market Team could revise and resubmit.
None of this structure existed in the Excel workflow. There was no locking, no approval flow, no separation between experimentation and official numbers. I designed it to preserve the flexibility that users valued while adding the trust and data integrity that the Pricing Team needed.
Building It
I did the wireframes in Balsamiq because it let me work fast and iterate during the workshops, sometimes adjusting flows based on questions that came up in the same session.
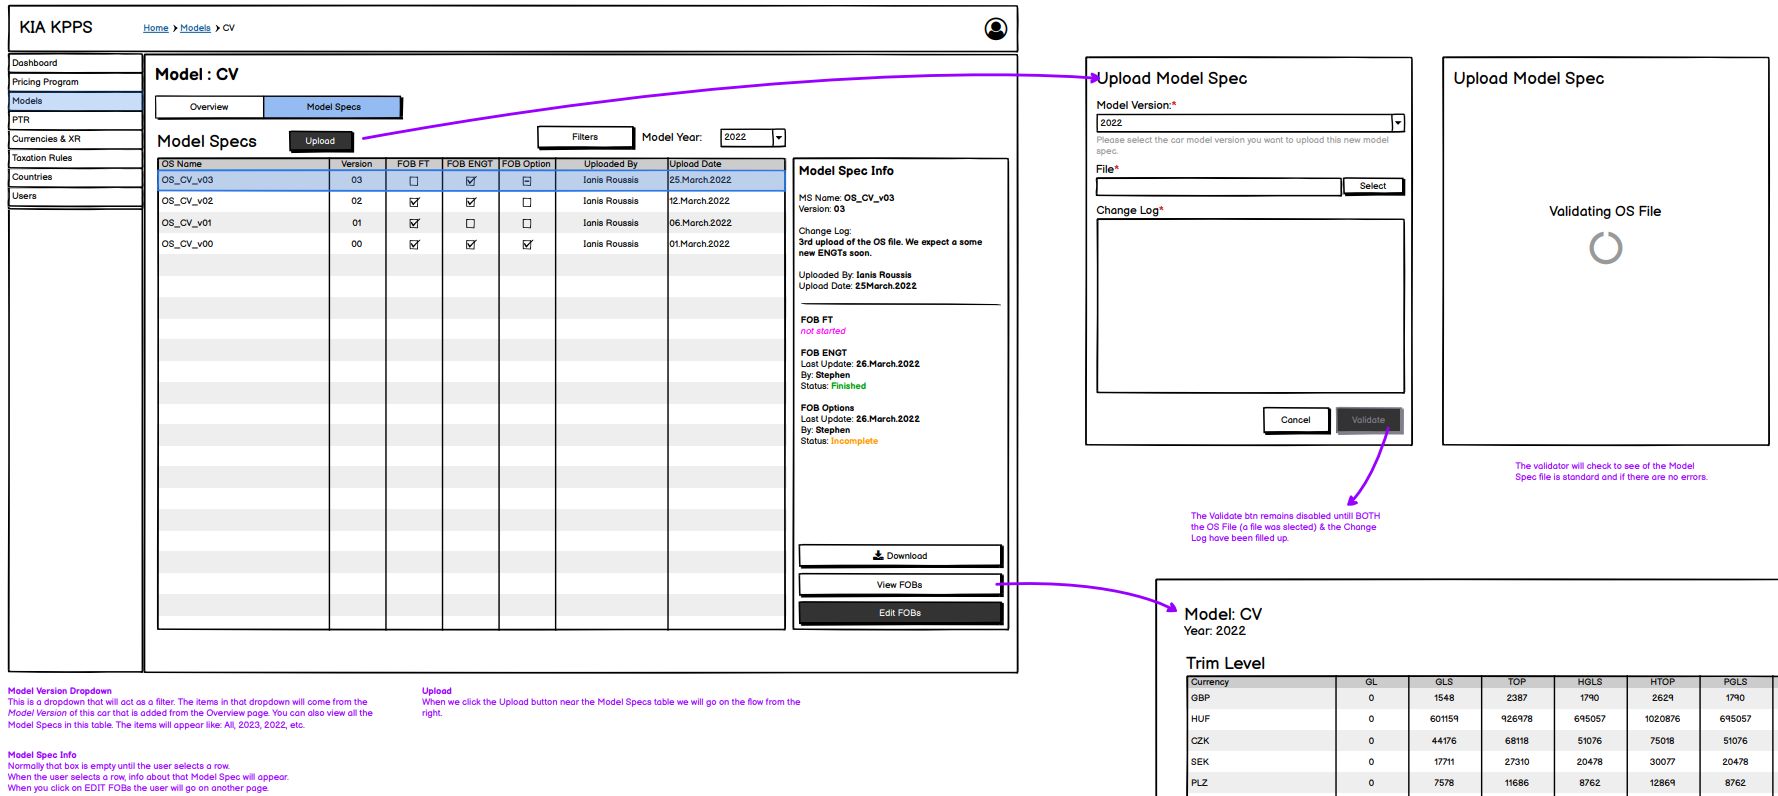
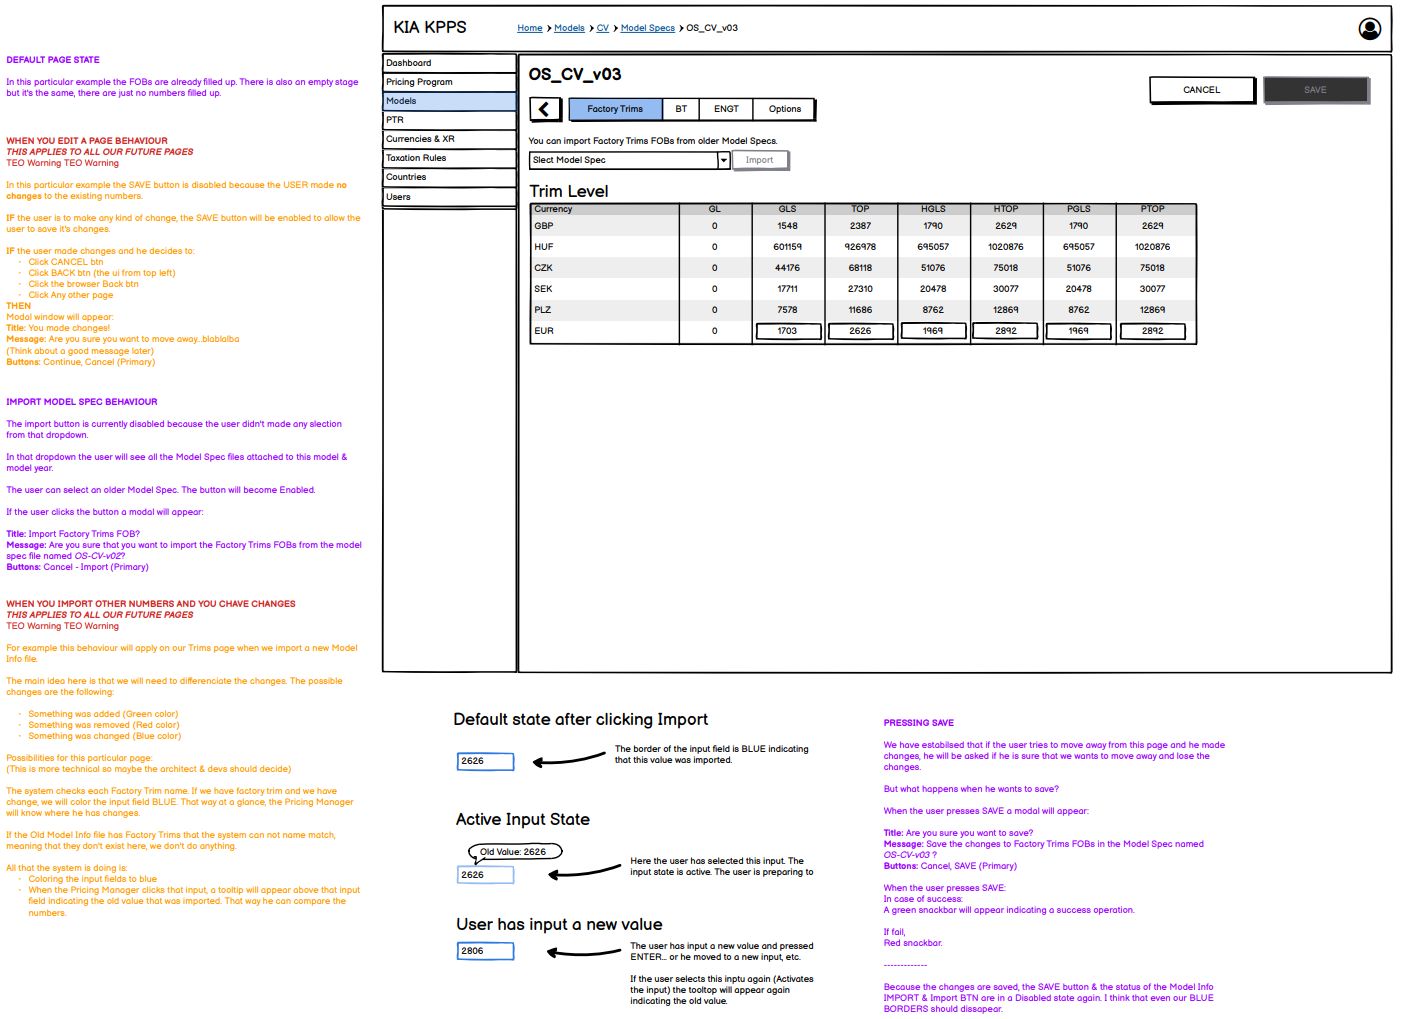
The wireframes ended up carrying a lot of weight beyond just the screen layouts. Every screen included annotations describing how interactions should work: what happens when a user imports new FOB data from an updated model spec (changed values highlighted in blue, the old value shown in a tooltip so the pricing manager can compare before saving), how the FOB priority system works (a local market FOB overrides a model-level overwrite, which overrides the base model FOB), validation rules for file uploads, what's visible or editable based on user permissions, and what the system should do when a user navigates away with unsaved changes. Edge cases were documented inline, things like what happens if a new currency year is added but no exchange rates have been entered yet.
The annotations were written for the UX Designer so he knew how to build the high-fidelity UI, and for the BA so he could write the user stories. Beyond drawing screens, I was explaining how the interactions work across the whole application.
For the UI, we built on MUI (Material UI) because the application was heavily table-driven. Nearly every screen needed structured data display with inline editing. We worked with the backend Architect early to align on React as the frontend framework, and chose an external tool for user permissions tied to KIA's Active Directory. The design system was an adaptation of MUI's Figma components matched to KIA's branding, built quickly because the priority was getting the interaction patterns right, not inventing a visual language from scratch.
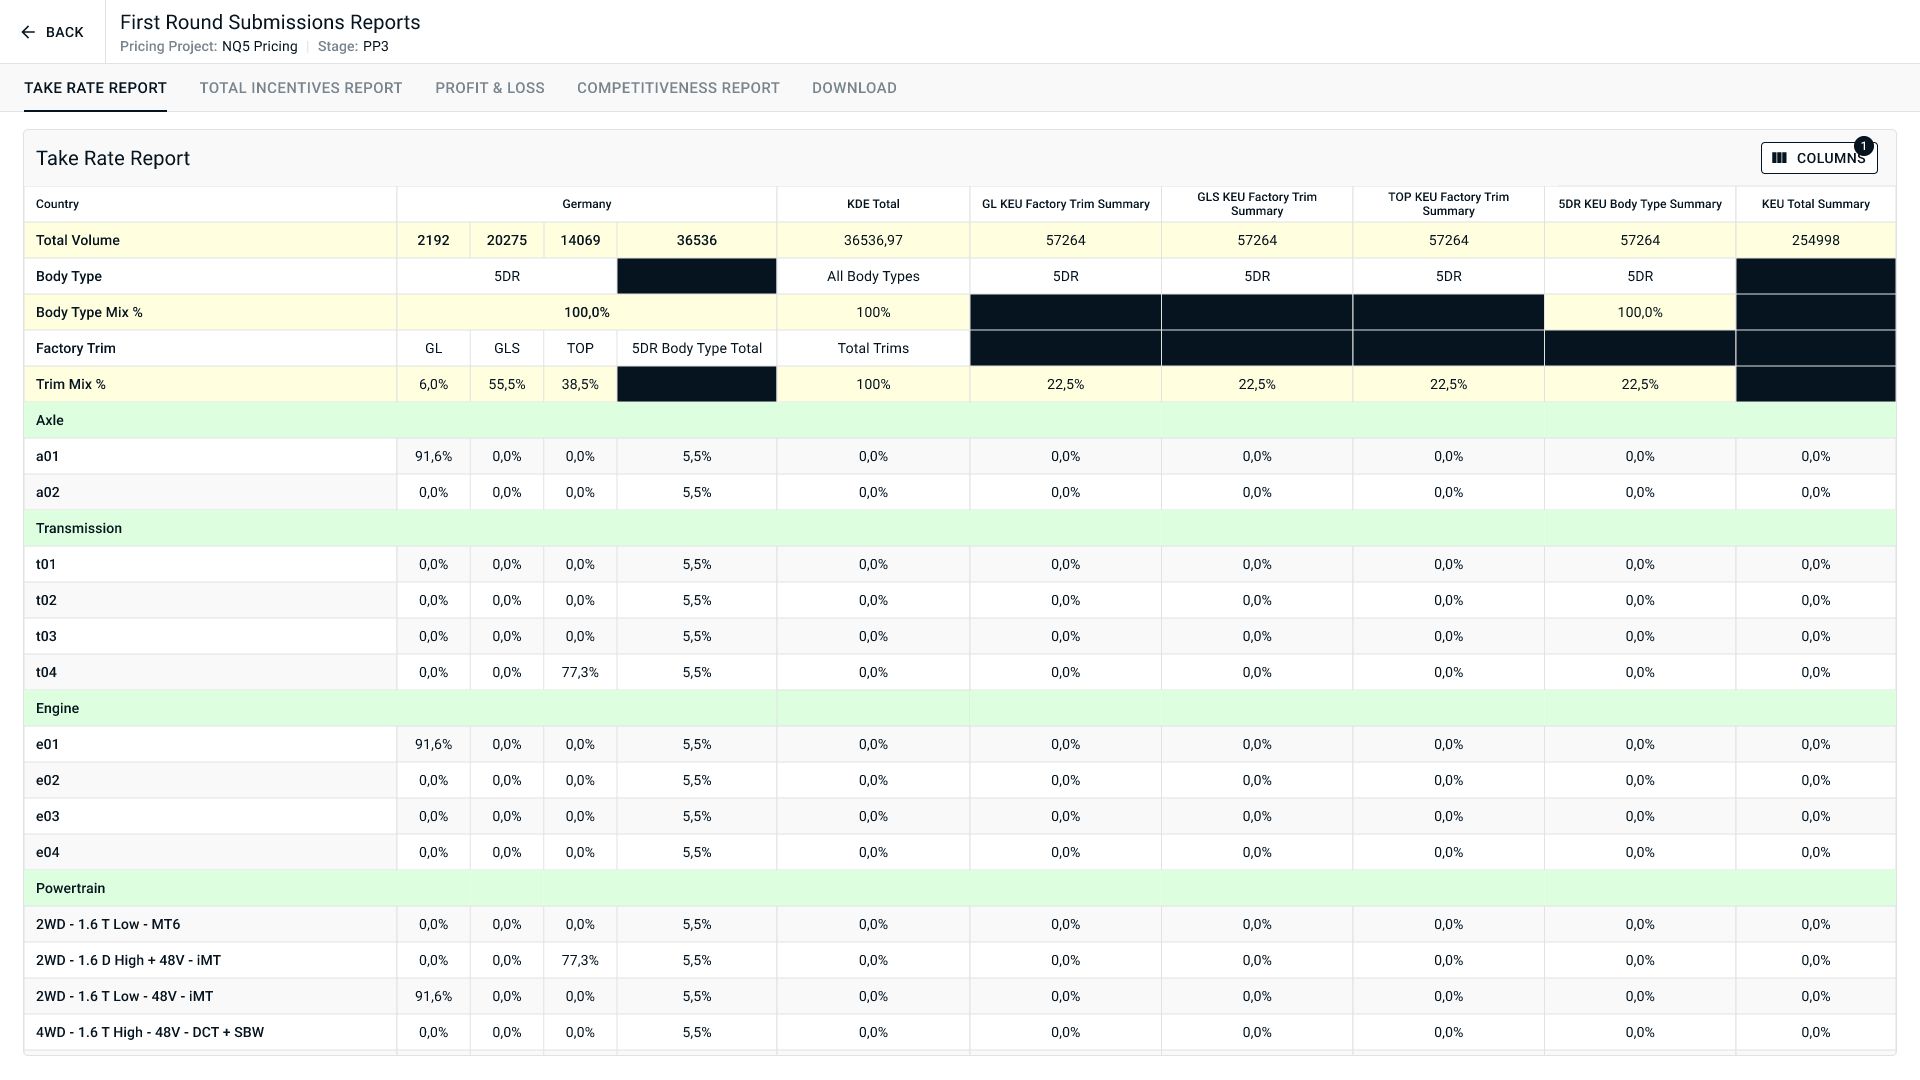
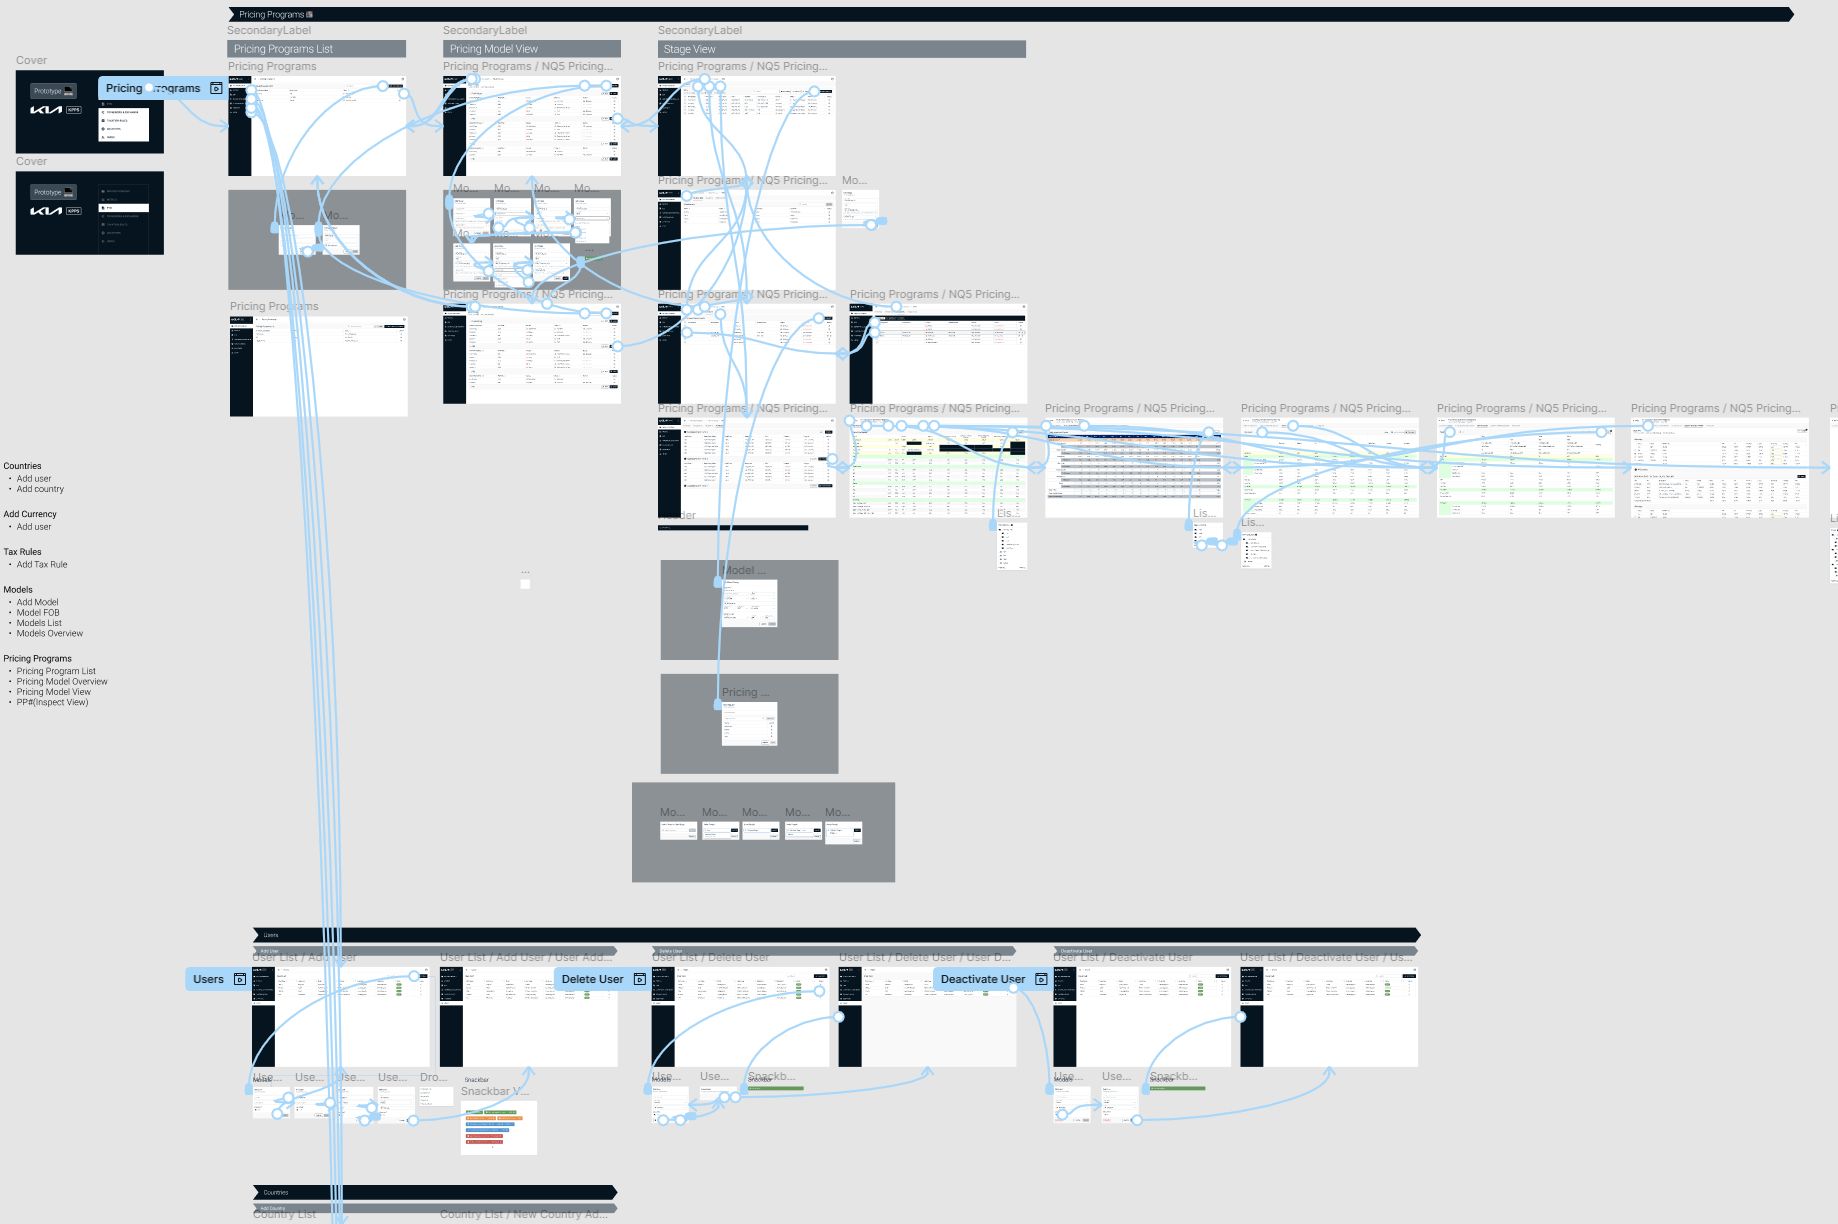
The final Figma prototype covered the complete application: all configuration pages, the full pricing workflow for both Official and Simulation paths, the approval and locking flow, the PTR quarterly review process, aggregation reports, and the competitive analysis module. It was so large it had to be split across two Figma files.
The Outcome
We demoed the prototype to the Market Users and gathered their feedback. The response was positive. They could see their existing workflow reflected in the new structure, but with the problems removed. The flexibility they valued was still there, the chaos wasn't.
The final deliverable was a fully specified Figma prototype covering the complete application across two files, along with the design system, information architecture, process maps, and annotated wireframes that could be used as a build reference. The stakeholder demo covering all flows ran just over an hour, which gives a sense of the application's scope.
KIA took the designs to build the application with a separate development team. We had bid for the
development phase ourselves, but we estimated around 80 sprints based on the complexity we'd spent
two months mapping. Another company estimated 40 and won the bid.